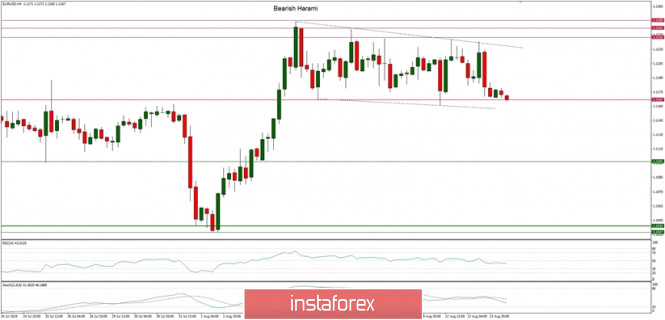
Technical Market Overview:
The Bullish Flag price pattern is clearly visible on the H4 timeframe chart at the EUR/USD pair and the market is still developing on a neutral momentum so far. The flag is the trend continuation pattern, so if the price will break out to the upside, the next target for bulls is seen at the level of 1.1250 and then 1.1345. The nearest technical support is seen at the level of 1.1167 and it can not be violated until the breakout occurs. Please notice that this time of the year the volatility might get limited due to the summer season, so it might take a while to make a breakout in this market conditions. The larget timeframe trend remains bearish.
Weekly Pivot Points:
WR3 - 1.1413
WR2 - 1.1325
WR1 - 1.1264
Weekly Pivot - 1.1187
WS1 - 1.1117
WS2 - 1.1041
WS3 - 1.0978
Trading Recommendations:
The best strategy for current market conditions is to trade with the larger timeframe trend, which is down. All upward moves will be treated as local corrections in the downtrend. The downtrend is valid as long as it is completed or the level of 1.1445 clearly violated. There is an Ending Diagonal price pattern visible on the larget timeframes that indicate a possible downtrend termination soon.

