To open long positions on EURUSD you need:
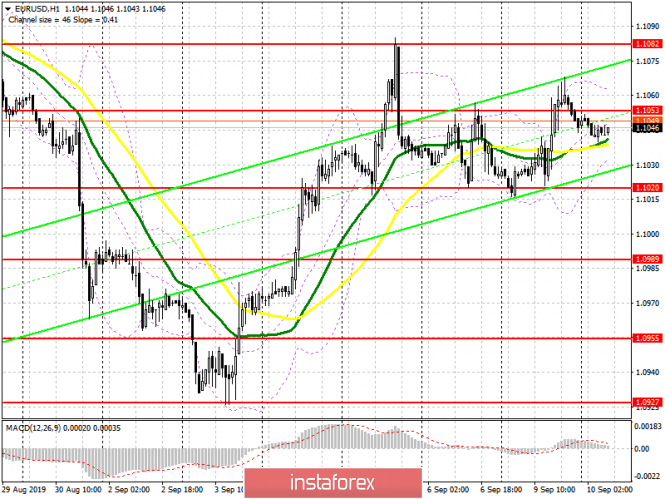
Yesterday, buyers of the euro kept the support level of 1.1020 and made an attempt to continue to grow amid a lack of fundamental data on the eurozone, but again failed to break above the resistance level of 1.1053. At the moment, the focus in the first half of the day will be concentrated at the same level of 1.1053, a breakdown of which will lead to an update of last week's high in the area of 1.1082, where I recommend taking profits. A bigger growth should not be expected due to an important European Central Bank meeting, the results of which will be known in a few days. The ECB is expected to lower interest rates. Under the scenario of EUR/USD decline, you can count on support in the region of 1.1020, however, opening long positions from there is best after a false breakdown, or buy the pair for a rebound from a low of 1.0989.
To open short positions on EURUSD you need:
From a technical point of view, nothing has changed. Euro sellers are activated after an update of resistance at 1.1053, and the formation of a false breakdown there will be the first signal to open short positions in the expectation of a return and correction to the support of 1.1020. However, a breakthrough and consolidation below this low continues to be a more important task, which will push EUR/USD to the area of large levels 1.0989 and 1.0955, where I recommend taking profits. In the event of further growth above the resistance of 1.1053, it is best to count on selling on a rebound from the high of 1.1082, which kept the pair yesterday from further growth in the last week.
Signals of indicators:
Moving averages
Trade is conducted in the region of 30 and 50 moving averages, which indicates market uncertainty.
Bollinger bands
In case of growth, the upward trend will be stopped near the upper boundary of the indicator 1.1065, while a breakthrough of the lower boundary in the area of 1.1030 may increase the pressure on the euro.

Description of indicators
- MA (moving average) 50 days - yellow
- MA (moving average) 30 days - green
- MACD: Fast EMA 12, Slow EMA 26, SMA 9
- Bollinger Bands 20
