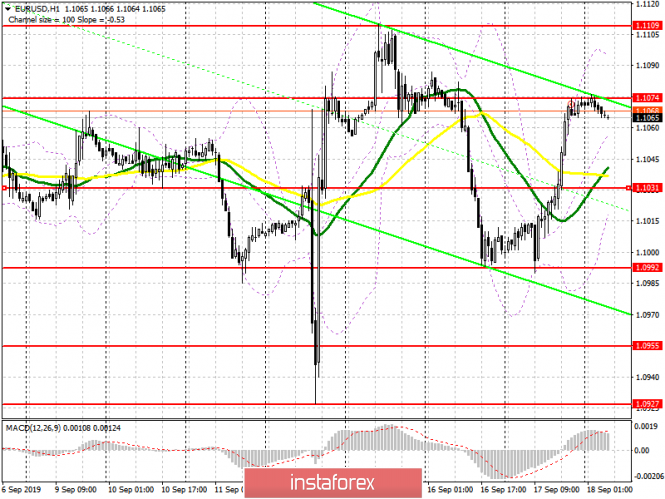
To open long positions on EURUSD you need:
Of course, all the attention today will be on the Fed's decision on interest rates, but we must not forget that in the first half of the day there is also an important report on the eurozone consumer price index, which may lead to further growth of EUR/USD. With good data indicating signs of inflation, buyers will seize the moment and try to break above the resistance level of 1.1074, which will lead to the continuation of the euro's growth from yesterday in the area of a high of 1.1110, as well as to update the larger resistance level of 1.1151, where I recommend taking profit. If the pressure on the euro returns in the morning, then consider new purchases before the Fed report, it is best after an update of support at 1.1031, or on the rebound from a larger low in the region of 1.0992.
To open short positions on EURUSD you need:
Sellers will wait for a weak inflation report, as well as a false breakdown in the resistance area of 1.1074, which may force some traders to take profits in long positions before the Fed's decision on interest rates is published, and will lead to a downward correction of EUR/USD to the support area of 1.1031, where I recommend taking profits. However, sellers will be aiming for a low of 1.0992. In case the pair grows above the resistance of 1.1074 in the morning, short positions can be seen on the test of the previous week's high at 1.1110, or you can immediately sell for a rebound from the new resistance of 1.1151. However, for those who expect a lower euro, it is best to wait for the Federal Reserve to announce interest rates.
Signals of indicators:
Moving averages
Trading is conducted above 30 and 50 moving average, which indicates an attempt to return buyers to the market.
Bollinger bands
A break of the lower boundary of the indicator in the area of 1.1031 will increase pressure on the euro, while the upper boundary in the area of 1.1095 will limit the upward potential in the morning.

Description of indicators
- MA (moving average) 50 days - yellow
- MA (moving average) 30 days - green
- MACD: Fast EMA 12, Slow EMA 26, SMA 9
- Bollinger Bands 20
