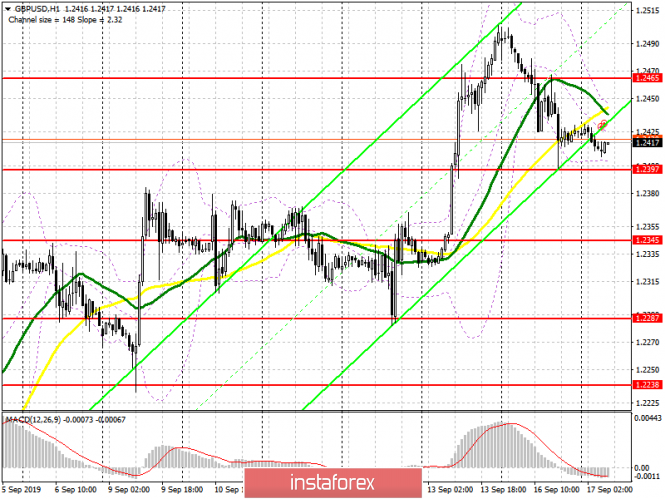
To open long positions on GBP/USD you need:
At the end of last week, the pound rose amid speculation that the UK government had drafted changes to the Brexit agreement. However, yesterday's unsuccessful meeting of Junker and Johnson showed that this is far from the case and the prime minister has nothing new that could make it possible to reach a favorable agreement with the EU. As for the buyers, they expectedly kept the level of 1.2397, however, after a slight correction upwards, the pressure on the pound is returning again. It is best to buy from the level of 1.2397 today in the morning after the formation of a false breakdown, and I recommend postponing larger long positions to support 1.2345. The bulls' task is to break through and consolidate above the resistance of 1.2465, which will return demand for the pound and lead to an update of the weekly high of 1.2534, where I recommend taking profits. However, one can count on a larger growth only with the advent of real Brexit solutions.
To open short positions on GBP/USD you need:
Pound sellers will attempt to break through the support of 1.2397, which will only raise the pressure on the pair and lead to a return to the lateral range of the previous week to the levels of 1.2345 and 1.2287, where I recommend taking profit. In the scenario of an upward correction in the morning, you can count on sales after the formation of a false breakdown in the region of 1.2465, since the further direction of the pair will depend on this level. If the bulls manage to regain 1.2465, it is best to consider new short positions for a rebound from a high of 1.2534.
Signals of indicators:
Moving averages
Trading is slightly below 30 and 50 moving averages, which indicates the likelihood of a bearish correction.
Bollinger bands
In case the pound declines, support will be provided by the lower boundary at 1.2397, a break which will increase the pressure on the pair. A breakthrough of the upper boundary of the indicator in the area of 1.2450 may lead to a new wave of growth for the pair.

Description of indicators
- MA (moving average) 50 days - yellow
- MA (moving average) 30 days - green
- MACD: Fast EMA 12, Slow EMA 26, SMA 9
- Bollinger Bands 20
