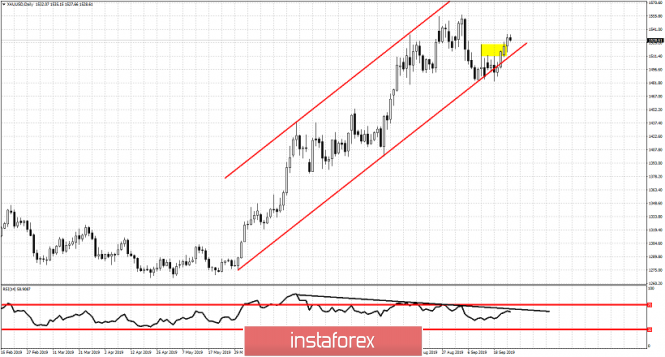
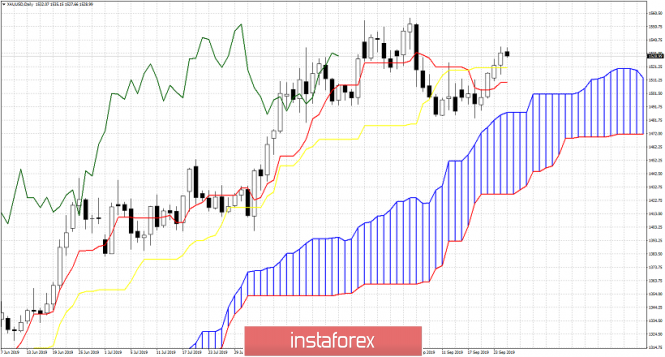
Gold price has broken above $1,520-25 short-term resistance area and must stay above it in order to continue to new 2019 highs. A reversal from the $1,530 area would be a bearish sign specially if price fails to hold $1,520-15.

Yellow rectangle -short-term resistance
Black line -RSI resistance
Gold price remains inside the medium-term bullish channel. Price has recently broken the yellow rectangle area and this is a bullish sign. Bulls need to continue to show signs of strength and price to continue to make higher highs and higher lows inside the channel. Otherwise we might be in danger of a reversal. Although price has broken through the short-term resistance area, the RSI is at the resistance trend line. This makes me feel uncomfortable being too optimistic despite the break of the $1,525 resistance. Bulls need to see the RSI also break the resistance.

