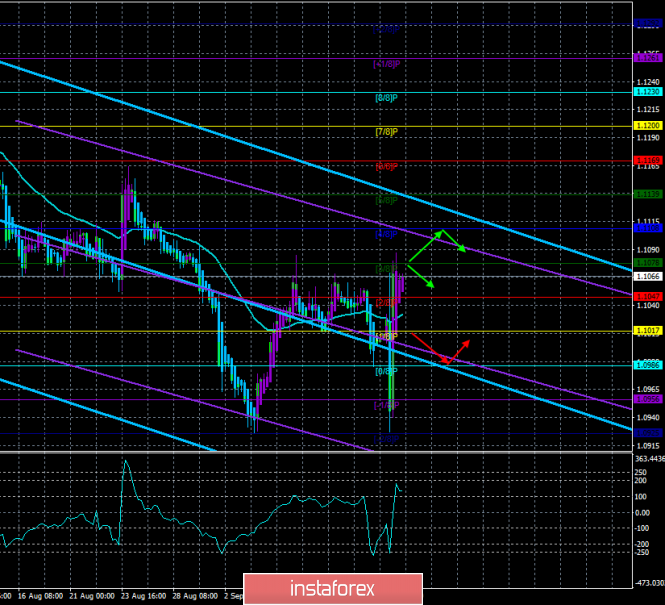
4-hour timeframe

Technical data:
The upper channel of linear regression: direction – down.
The lower channel of linear regression: direction – down.
The moving average (20; smoothed) – sideways.
CCI: 133.4252
Well, completely crazy Thursday, with a lot of important information, publications, and speeches left behind. And the euro, paired with the US dollar, after jerking to each side by more than 100 points, returned to its original position and even added value in the past day. We already said yesterday that the main reason for the strengthening of the euro after falling by 100 points lies in the US inflation report, which was not just weak, but also very important, as it significantly increased the likelihood of a new Fed rate cut. The euro, quite unexpectedly, gets the basis for the beginning of the formation of an upward trend, since the pattern "double bottom" is visible on the chart. Of course, if tomorrow it turns out that the Fed will not reduce the rate, and the ECB will continue to act "ultra-soft", then the "double bottom" will not save the euro from new falls. However, this is still a factor in favor of the pair's growth in the coming days and weeks.
On Friday, September 13, there will be a few macroeconomic reports. We are talking about changes in retail sales in August and the consumer confidence index from the University of Michigan. According to experts, the first indicator will grow by 0.3%, the second will increase from 89.8 to 90.9. Well, let's look at the real values of these indicators. If they are higher than forecast, then crazy Thursday may get its continuation today, as the US currency may feel the support of the foreign exchange market.
In addition to the above, we would like to draw traders' attention to possible further actions of the ECB. Mario Draghi said nothing about them at his speech yesterday. Thus, traders can only guess whether the ECB will stop at such easing or will announce the expansion of the stimulus package at the October meeting? We are inclined to believe that the volume of monthly asset repurchase at the next meeting of the ECB will not change, since the quantitative easing program itself will resume only in November 2019. Thus, the question remains only in the rates, but rather in the deposit rate. Since the reduction of the deposit rate is very hard on commercial banks, we believe that the regulator will be extremely cautious and slow in changing it, as the banking system needs to be given time to adapt to new conditions. Thus, it is most likely that the use of new tools to support the economy of the European Union will be seen by Christine Lagarde.
From a technical point of view, the euro/dollar pair rose to the Murray level of "3/8" - 1.1078, but new fundamental factors are needed to continue the growth. The growth continued, which was caused again not by optimistic data from the European Union, but by weak data from the States. Both linear regression channels indicate a continuing downward trend.
Nearest support levels:
S1 – 1.1047
S2 – 1.1017
S3 – 1.0986
Nearest resistance levels:
R1 – 1.1078
R2 – 1.1108
R3 – 1.1139
Trading recommendations:
The euro/dollar has fixed above the moving average line, so the trend is now again upward, but only in the short term. Thus, it is recommended to consider purchases of the euro in small lots with the goals of 1.1108 and 1.1139 before the Heiken Ashi indicator turns down.
In addition to the technical picture, fundamental data and the time of their release should also be taken into account.
Explanation of illustrations:
The upper linear regression channel – the blue line of the unidirectional movement.
The lower linear regression channel – the purple line of the unidirectional movement.
CCI – the blue line in the indicator window.
The moving average (20; smoothed) – the blue line on the price chart.
Support and resistance – red horizontal lines.
Heiken Ashi is an indicator that colors bars in blue or purple.
The material has been provided by InstaForex Company - www.instaforex.com