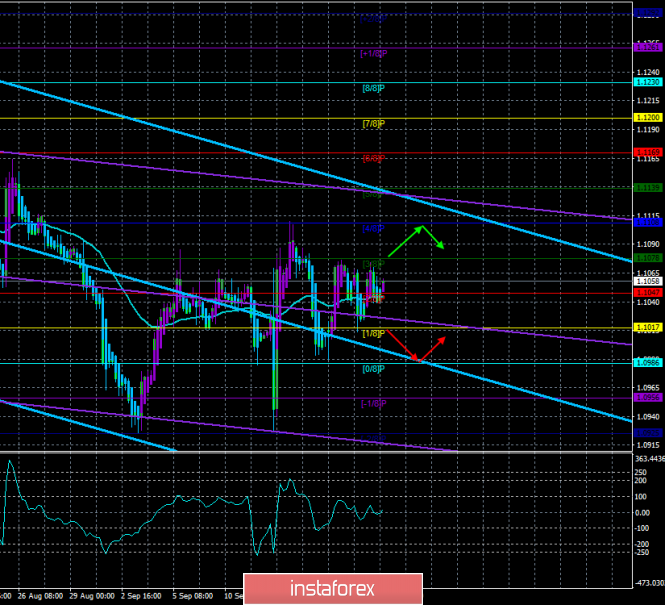
4-hour timeframe

Technical data:
The upper channel of linear regression: direction – down.
The lower channel of linear regression: direction – down.
The moving average (20; smoothed) – sideways.
CCI: 20.7650
Here comes the last trading day of the week, which was supposed to be fantastic for the EUR/USD pair, and instead we observe either high volatility or a low volatility flat. The trading week ended with a fall in traders' activity to almost zero. On Friday, September 20, not a single important macroeconomic publication is planned, so there will be no fundamental background for the euro/dollar pair today. Thus, we do not expect strong movements from the currency pair today, we do not expect that a trend movement will suddenly begin. Most likely, the week will end as calmly as it passed.
Today, we can once again ask ourselves, what awaits the pair in the coming weeks? Still, at the moment, the meetings of both central banks are over and it is possible to draw certain conclusions on their monetary policy, as well as on the attitude of traders to the adopted changes. In short, the ECB eased the already "ultra-soft" monetary policy, because there was simply no other way, and the Fed lowered its key rate when it was not particularly necessary, from macroeconomic statistics. What does that say? The fact that the US dollar in confrontation with the euro remains "on horseback" in the medium term. The European Central Bank will also launch a quantitative easing program in November for 30 billion euros per month. Thus, despite the "double bottom" pattern, which we have already discussed several times, despite the seemingly favorable time for the strengthening of the euro, the prospects for this currency, from our point of view, remain very vague. If a trade war begins, as many experts expect, in October-November, then a single European one will not be envied at all, since it is already clear who will benefit from the trade conflict. More precisely: who will suffer less damage from the trade conflict.
What about the reaction of traders to two meetings of regulators? At the meeting, the ECB reacted first with the stormy purchases of the dollar, then with the same stormy euros, after which everything calmed down. At the Fed meeting – restrained purchases of the dollar, which the next day was completely leveled. As a result, the pair continues to remain near its two-year lows, with the "double bottom" pattern, which is not implemented, since the euro/dollar pair is not growing, but it is not canceled since bears are not able to update the lows once again. And in our experience, we can say that such a state can last for several days, and maybe even weeks.
From a technical point of view, we have a formally upward trend, since the price is above the moving average, but in fact, we have a flat at our disposal. Over the past few days, the pair changed direction and overcame the moving average 6 times.
Nearest support levels:
S1 – 1.1047
S2 – 1.1017
S3 – 1.0986
Nearest resistance levels:
R1 – 1.1078
R2 – 1.1108
R3 – 1.1139
Trading recommendations:
The euro/dollar pair has fixed back above the moving average line, however, we now recommend waiting for the completion of the flat and only then resume trading.
In addition to the technical picture, fundamental data and the time of their release should also be taken into account.
Explanation of illustrations:
The upper linear regression channel – the blue line of the unidirectional movement.
The lower linear regression channel – the purple line of the unidirectional movement.
CCI – the blue line in the indicator window.
The moving average (20; smoothed) – the blue line on the price chart.
Support and resistance – red horizontal lines.
Heiken Ashi – an indicator that colors bars in blue or purple.
The material has been provided by InstaForex Company - www.instaforex.com