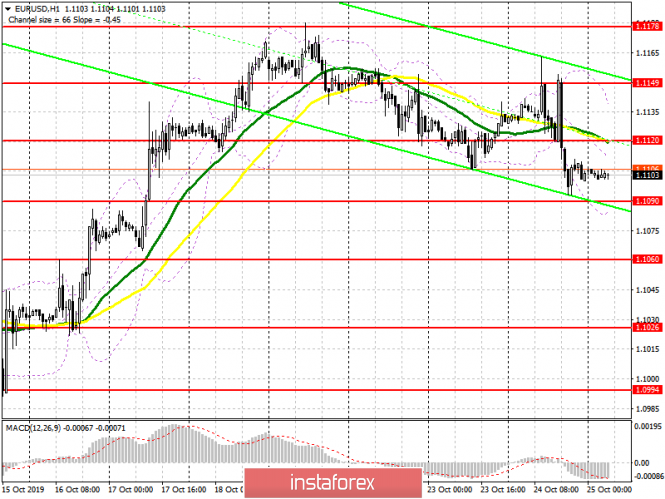
To open long positions on EURUSD you need:
Mario Draghi said yesterday that he was ready to take any measures to stimulate economic growth, which put pressure on the euro, as most likely the regulator will lower rates again at the end of this year. US manufacturing growth supported the dollar. At the moment, the bulls need the formation of a false breakout in the support area of 1.1090, which may coincide with the release of good data from the IFO Institute in Germany. However, return to a resistance of 1.1120 continues to be a more important goal for euro buyers, above which the bulls will pick up the pair, which will make it possible to update highs of 1.1149 and 1.1178, where I recommend profit taking. If pressure on the euro continues, which is also very likely, it is best to open new long positions in EUR/USD by rebounding from a new low of 1.1060.
To open short positions on EURUSD you need:
Sellers will try to take advantage of the weak IFO report on the conditions of the German business environment, and the formation of a false breakout in the resistance area of 1.1120 will be an additional signal to open short positions. The main target of the bears will be the lower boundary of the current descending channel, which coincides with the first support level of 1.1090. A breakthrough in this area will increase pressure on the euro, which will lead the pair to lows in the area of 1.1060 and 1.1026, where I recommend profit taking. If EUR/USD rises above the resistance on the data, it is best to consider short positions from yesterday's resistance of 1.1149, which was formed after a press conference by Mario Draghi.
Moving averages
Trading is conducted below 30 and 50 moving averages, which indicates the preservation of the bearish momentum.
Bollinger bands
If the euro rises in the first half of the day, the upper boundary of the indicator in the 1.1136 area will act as resistance. A break of the lower boundary in the region of 1.1090 will put new pressure on the pair.

Description of indicators
- MA (moving average) 50 days - yellow
- MA (moving average) 30 days - green
- MACD: Fast EMA 12, Slow EMA 26, SMA 9
- Bollinger Bands 20
