EUR/USD
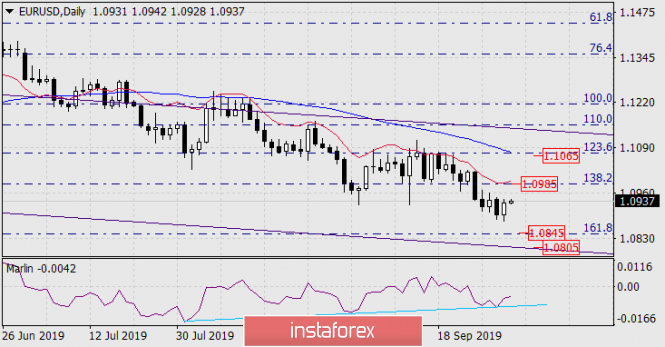
The euro sharply jumped by 40 points on Tuesday after the release of the disappointing index of business activity in the manufacturing sector from ISM - in September, the indicator fell to 47.8 from 49.1, while investors expected growth to 50.4. The technical picture has now become almost a reversal - a double convergence has formed on the daily chart. But this first glance may turn out to be erroneous. If we allow this option, then the big players lose their sense of pushing the euro from September 18, which we wrote about earlier. There are also two strong resistances in front of the price: 1.0985 - the Fibonacci level of 138.2%, and 1.1065 - the Fibonacci level of 123.6% and the MACD line. And until the first resistance is overcome, the observed growth will be interpreted by us as having only a psychological basis.

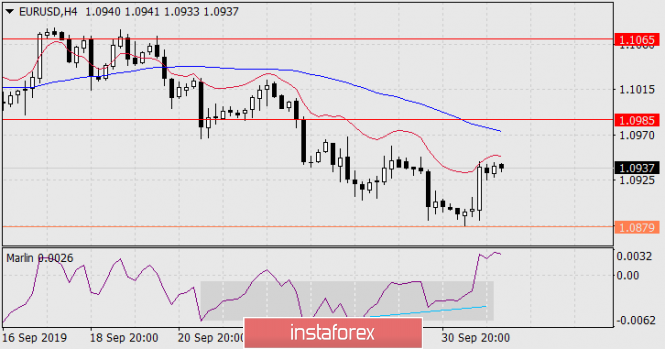
On the four-hour chart, the rising moment is strongly expressed; the signal line of the Marlin oscillator worked out convergence with the transition to the growth zone and went up from the range indicated in the window in gray. But this also shows the short duration of the movement - the Marlin line has drawn vertically upward, will soon reach the overbought zone, which predicts a probable restoration of a declining trend.

So, after overcoming the price of the first resistance at 1.0985, it is likely that the correction will continue to the target of 1.1065. After leaving the price at yesterday's low of 1.0879, the euro will again try to work out the target range of 1.0805/45.
The material has been provided by InstaForex Company - www.instaforex.com