EUR/USD
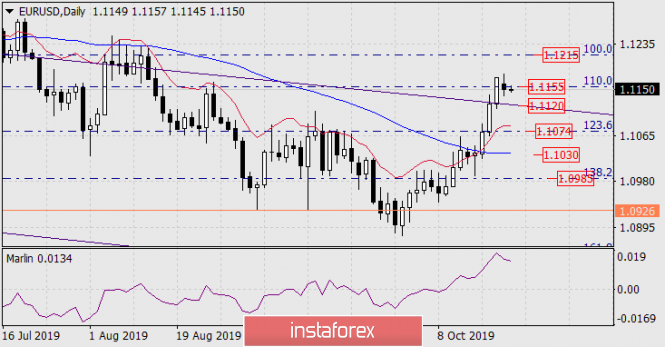
The Brexit situation has stalled since the beginning of the new week, and the currency market along with it. The British Parliament refused to vote on the same version of the deal several times. The euro stopped at a Fibonacci level of 110.0%, on a wider story this is the resistance zone of the end of April-the first half of early May, the first half of June 2017, September 2016, etc. The indicators are growing on the daily chart.

The main scenario for further events is the euro's fall to the price channel line to the area of 1.1120 and the resumption of growth to the Fibonacci level of 100.0% at the price of 1.1215. Here it is possible to ease the indicators and prepare the market for a decline in the phase of accurate profit taking. Profit-taking will be the main sign of a turnaround, as the volume of purchases has been the largest since the beginning of September.
Forecasts on economic indicators are also not in favor of the dollar: home sales in the US secondary real estate market in September are expected to be 5.45 million compared to 5.49 million a month earlier, European PMIs for October will come out on Thursday, which are projected to increase.

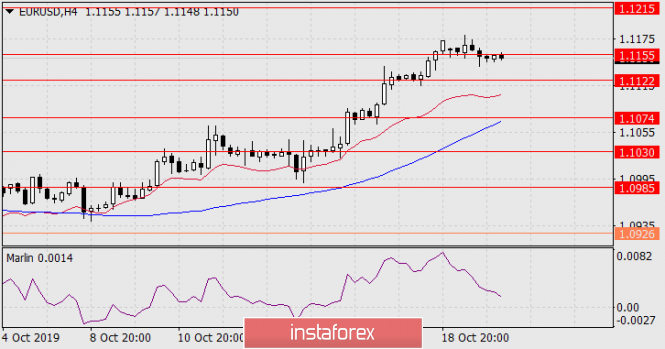
On the four-hour chart, the Marlin oscillator went down sharply, but it still remains in the growing trend zone.
The material has been provided by InstaForex Company - www.instaforex.com