To open long positions on GBP/USD you need:
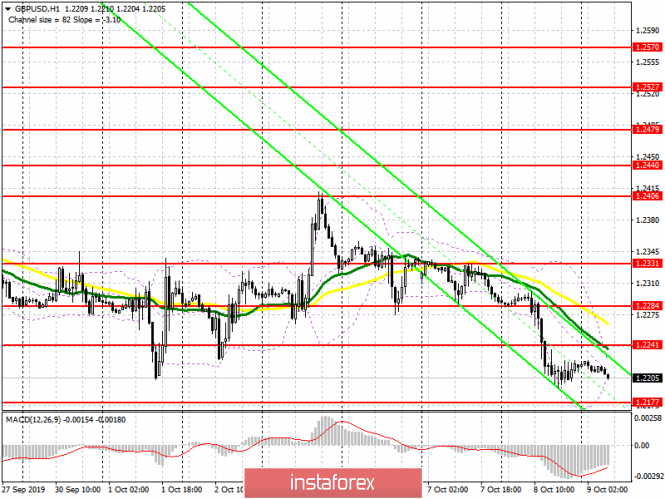
Yesterday's news that the EU was not happy with Boris Johnson's proposal again led to increasing likelihood of a Brexit without a deal, which put pressure on the British pound and returned the market to a downward trend. For purchasing, I recommend focusing on a support of 1.2177, near which bullish divergence on the MACD indicator can form, which will be the first signal to open long positions, the main goal of which will be to return to a resistance of 1.2241. Only after consolidating above this range can we discuss the topic of an upward correction to the resistance of 1.2284, where I recommend profit taking. If the situation with Brexit continues to aggravate, and most likely it will happen, it is best to consider new long positions after updating lows in the areas of 1.2150 and 1.2112.
To open short positions on GBP/USD you need:
Today it is best to sell the pound after the formation of a false breakdown in the resistance area of 1.2241, slightly above which the moving averages are located. However, a more important task for the bears will be to break through and consolidate under the support of 1.2177, which will increase pressure on GBP/USD and will lead to updating lows of 1.2150 and 1.2112, where I recommend taking profits. However, be careful, as during the first test of the level of 1.2177, the pair may increase against the background of the divergence formed on the MACD indicator. In case the pound grows above resistance at 1.2241 in the first half of the day, you can count on short positions immediately on a rebound from a high of 1.2284.
Signals of indicators:
Moving averages
Trading is below 30 and 50 moving averages, which indicates a bearish nature of the market and a further decline in the pound.
Bollinger bands
A break of the lower boundary of the indicator at 1.2210 will increase pressure on the British pound, while a break of the upper boundary at 1.2220 may lead to a larger upward correction.

Description of indicators
- MA (moving average) 50 days - yellow
- MA (moving average) 30 days - green
- MACD: Fast EMA 12, Slow EMA 26, SMA 9
- Bollinger Bands 20
