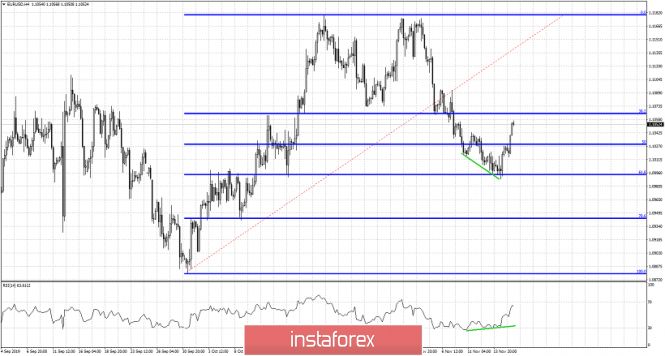
In previous we mentioned the increased probability of a bounce in EURUSD from the major Fibonacci retracement support level around 1.10. Price has bounced from 1.0988 low and the 61.8% Fibonacci retracement level.

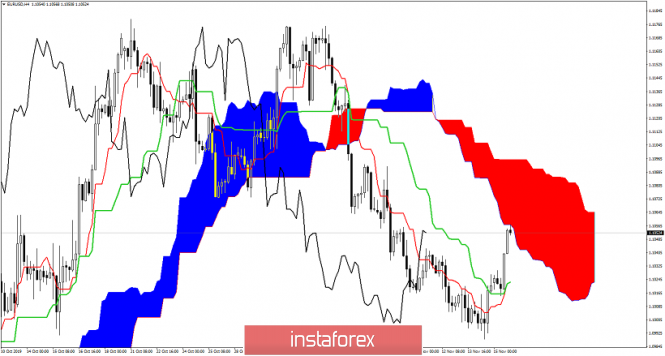
EURUSD ended the week at 1.1052 having bounced off the important Fibonacci support level we mentioned. Additionally we also noted that bullish divergence signs were evident in the 4 hour RSI and that was a warning for bears. This warning was a sign of increased chances of a bounce....The bounce came and it is now very important to see how this week unfolds. Has EURUSD made an equally important higher low relative to the October low of 1.0880. Is this the level where we see the start of a new upward wave that will eventually push price above 1.12?There are many chances of this happening.

