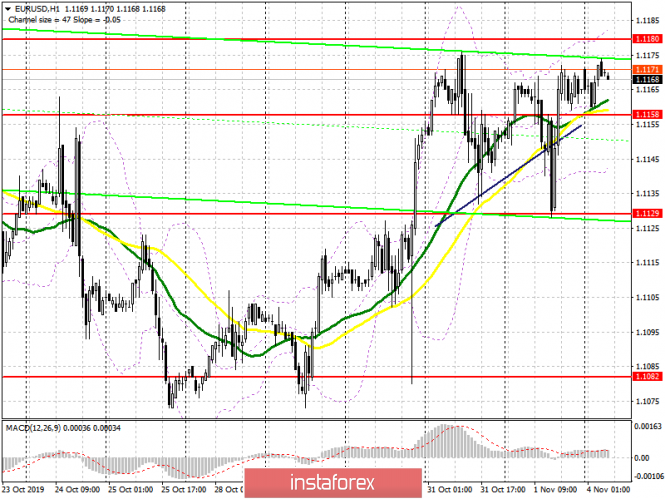
To open long positions on EURUSD, you need:
Friday's data on the US labor market led to the strengthening of the dollar, but a very weak report indicating a reduction in manufacturing activity in the US quickly returned the euro to the buyers market. Now, trading is above the intermediate support of 1.1158, and the formation of a false breakdown at this level will be a signal to buy EUR/USD. However, the more important task of the bulls, which will allow us to talk about the continuation of the upward trend, will be a breakthrough and consolidation above the maximum of 1.1180, since only its breakdown will open a direct path for the euro to new levels of 1.1226 and 1.1289, where I recommend taking the profits. If the pressure on the pair returns, which is likely to happen after today's weak data on manufacturing activity in the eurozone, a breakthrough of the level of 1.1158 will push the pair into the support area of 1.129, from where it is possible to break long positions provided a false breakdown. I recommend buying immediately for a rebound only from a larger area of support for this week – 1.1082.
To open short positions on EURUSD, you need:
Sellers need to hold the level of 1.1180, the formation of a false breakdown will be the first signal to open short positions. The target will be the intermediate support of 1.1158, but the only consolidation below this range will push EUR/USD even lower, to the area of the minimum of 1.129, where I recommend taking the profits. The focus of euro sellers will be on the release of reports on manufacturing activity in Italy, France, and the eurozone. Weak indicators, which are predicted by economists, will push the pair even lower in the area of 1.1082. In the case of the euro's growth in the first half of the day above the resistance of 1.1180, it is best to return to short positions on the rebound from the highs of 1.1226 and 1.1289.
Indicator signals:
Moving Averages
Trading is conducted in the area of 30 and 50 moving averages, which indicates the lateral nature of the market.
Bollinger Bands
To continue the growth, a breakthrough in the upper limit of the indicator in the area of 1.1185 is needed. The downward movement may be limited to the lower level around 1.1145.

Description of indicators
- MA (moving average) 50 days – yellow
- MA (moving average) 30 days – green
- MACD: fast EMA 12, slow EMA 26, SMA 9
- Bollinger Bands 20
