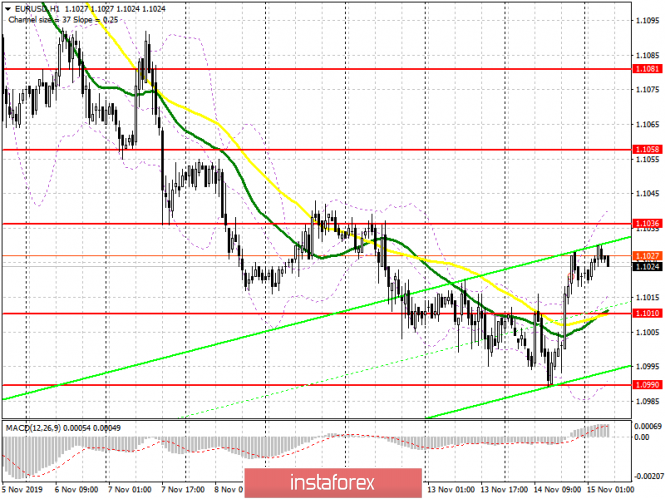
To open long positions on EURUSD you need:
Yesterday's data on producer prices in the United States made it possible to remain bearish in the EUR/USD pair, however, the absence of sellers below the level of 1.1000 led to an upward correction at the end of the US session. At the moment, buyers will focus on support at 1.1010, in which I recommend to open long positions when forming a false breakout. Good data on inflation in the eurozone may contribute to the euro's growth above the resistance of 1.1036, and consolidation at this level will lead to the continuation of the upward correction to the area of highs of 1.1058 and 1.1081, where I recommend profit taking. If there is no activity among buyers near 1.1010, I recommend that you open long positions in EUR/USD immediately to rebound from the weekly low of 1.0990.
To open short positions on EURUSD you need:
Sellers will not rush to return to the market, as a small correction is not enough for large players who failed to keep the pair below the level of 1.1000 yesterday. Only the formation of a false breakout in the resistance area of 1.1036, along with weak eurozone inflation data, will be a signal to open short positions in the euro in order to fall to a support of 1.1010. However, a more important goal for sellers will be to close the day below this range, which will maintain a downward trend next week and lead to an update of the lows of 1.0990 and 1.0960. In the EUR/USD growth scenario above the resistance of 1.1036, it is best to count on short positions after updating the high of 1.1058, or sell immediately for a rebound from a larger level of 1.1081.
Signals of indicators:
Moving averages
Trading is conducted above 30 and 50 moving average, which indicates the likely formation of an upward correction in the pair.
Bollinger bands
Growth will be limited by the upper level of the indicator in the region of 1.1040, a breakthrough of which will provide the pair with a new influx of buyers. In case of decline, it is best to consider long positions after updating the lower boundary of the indicator at 1.1000.

Description of indicators
- MA (moving average) 50 days - yellow
- MA (moving average) 30 days - green
- MACD: Fast EMA 12, Slow EMA 26, SMA 9
- Bollinger Bands 20
