To open long positions on EURUSD you need:
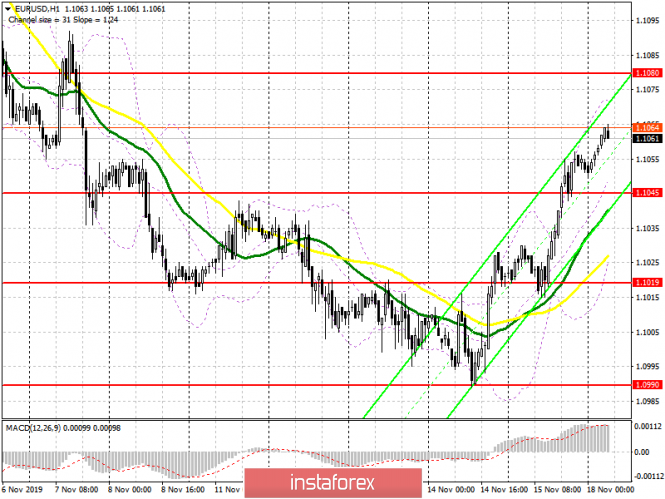
On Friday afternoon, data on industrial production in the United States helped buyers of the euro to continue the upward correction. The report indicated a decline in production by 0.8%, which weakened the position of the US dollar. At the moment, the task of the bulls at the beginning of this week is to maintain the support of 1.1045, and the formation of a false breakout there will be a direct signal to euro purchases. The immediate goal of the bulls will be the resistance test of 1.1080, where I recommend profit taking, as you can hardly expect growth to 1.1101 without good fundamental data on the eurozone. In the case of a decrease in EUR/USD to a support of 1.1045, it will be too early to talk about the return of sellers to the market, as the bulls will try to resume growth from a larger low of 1.1019.
To open short positions on EURUSD you need:
Sellers will not rush to return to the market. Only the formation of a false breakout in the resistance area of 1.1080 will serve as the first signal to open short positions. However, selling the euro right away on the rebound is best after a test of a high of 1.1101. Counting on a major bullish trend would not be entirely correct without good news in the eurozone and given the lack of news at the beginning of the week. Bears can take advantage of this moment and return to the support level of 1.1045. However, a more important task for sellers will be consolidation below this range, which will push the euro to a low of 1.1019, where I recommend profit taking. If this week we are talking about the fact that the Fed will not lower interest rates this year, demand for the US dollar may return after the correction, as the downward trend from November 1 remains.
Signals of indicators:
Moving averages
Trading is conducted above 30 and 50 moving average, which indicates the likely continuation of the upward correction in the pair.
Bollinger bands
Growth will be limited by the upper level of the indicator in the region of 1.1070. In case of a decrease in the pair, it is best to consider long positions after updating the lower boundary of the indicator in the region of 1.1030.

Description of indicators
- MA (moving average) 50 days - yellow
- MA (moving average) 30 days - green
- MACD: Fast EMA 12, Slow EMA 26, SMA 9
- Bollinger Bands 20
