To open long positions on EURUSD you need:
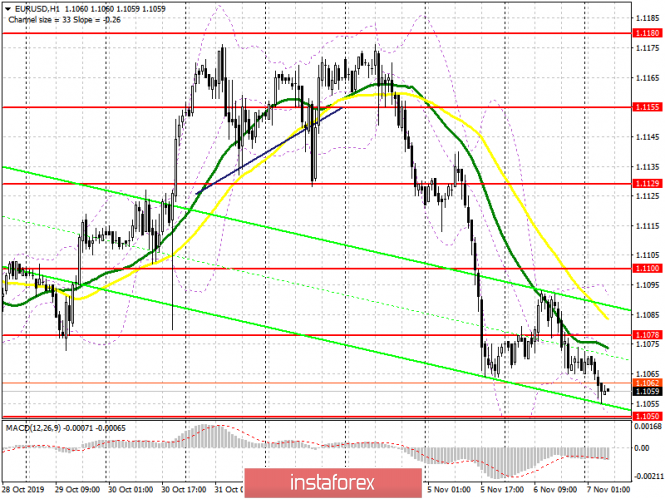
Yesterday's reports on the services sector of the eurozone countries provided some support for the European currency, but this did not lead to a major upward correction. Today, the estimate is back to the support level of 1.1050 and only the formation of a false breakout on it will be the first signal to open long positions in the expectation of a return to the resistance of 1.1078. The data on the volume of industrial production in Germany, the output of which is planned at the beginning of the European session, can help in this. However, it will be possible to count on a larger upward correction only after the growth and consolidation of EUR/USD above the level of 1.1078, which will lead to the renewal of the highs of 1.1100 and 1.1129, where I recommend profit taking. In the absence of demand for the euro in the region of a low of 1.1050, it is best to count on new long positions on a rebound from support of 1.1026 and 1.0994.
To open short positions on EURUSD you need:
Yesterday, the bears managed to return the pair to the support level of 1.1078, which was lost in the morning. The primary task of sellers of European currency today is to break through and consolidate below the support of 1.1050, to which they have come close at Asian trading. Only after this we can expect a further downward trend of EUR/USD to the area of lows 1.1026 and 1.0994, where I recommend profit taking. Demand may return in the event of a good report on Germany and forecasts of the European Commission. In this scenario, short positions can be considered after the formation of a false breakout in the area of yesterday's resistance at 1.1078, or then sell immediately for a rebound only after a test of the highs 1.1100 and 1.1129.
Signals of indicators:
Moving averages
Trading is conducted below 30 and 50 moving averages, which indicates a bearish nature of the market.
Bollinger bands
In case of growth, the upper boundary of the indicator in the region of 1.1090 will act as resistance. In case of decrease, support will be provided by the lower boundary of the indicator in the region of 1.1050.

Description of indicators
- MA (moving average) 50 days - yellow
- MA (moving average) 30 days - green
- MACD: Fast EMA 12, Slow EMA 26, SMA 9
- Bollinger Bands 20
