To open long positions on GBP/USD you need:
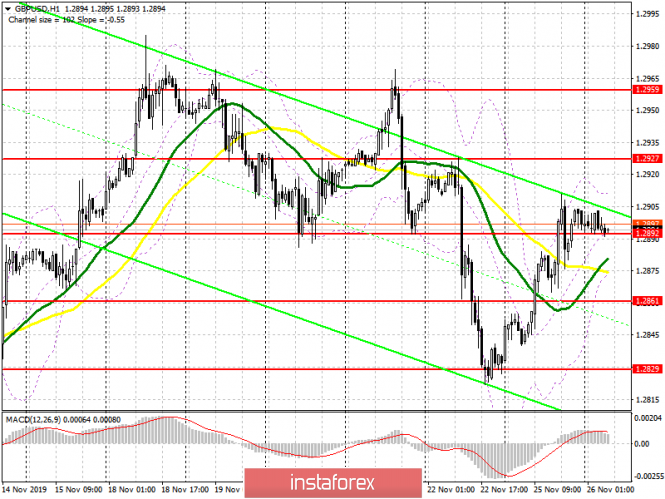
Yesterday, pound buyers coped with all the tasks after good polls in the UK, which indicated the Conservative Party's leadership. At the moment, trading is conducted above the support of 1.2892, and the formation of a false breakout in the first half of the day can lead to a new growth of GBP/USD with the renewal of highs around 1.2927 and 1.2959. However, such a wave requires good news from the election race. If bulls lose the support of 1.2829 in the morning, then I recommend to postpone long positions until the level of 1.2861 is updated, or buy immediately for a rebound in the region of the low of 1.2829, where GBP/USD buyers will try to form a new lower boundary for the ascending channel.
To open short positions on GBP/USD you need:
It is enough for sellers to return the pair to support at 1.2892 in the morning, which will make pound buyers nervous and take profits. Against this background, GBP/USD will slowly return to the low of 1.2861, which large players will try to break through to ensure that the pair decreases to a support of 1.2829, where I already recommend profit taking, as new buyers will begin their active actions there. In the scenario of the continuation of the current upward correction, which may result in a full trend, the bears will be noticeable in the resistance area of 1.2927, where you can open short positions only if a false breakout is formed. I recommend selling immediately for a rebound only after a test of a high of 1.2959.
Signals of indicators:
Moving averages
Trading is above 30 and 50 moving averages, and the bears need to move the pair below the averages to return the downward wave.
Bollinger bands
The first attempt at sales will be restrained by the lower boundary of the indicator at 1.2875. A break of the upper boundary in the area of 1.2915 may lead to a new wave of GBP/USD growth.

Description of indicators
- Moving average (moving average determines the current trend by smoothing out volatility and noise). Period 50. The graph is marked in yellow.
- Moving average (moving average determines the current trend by smoothing out volatility and noise). Period 30. The graph is marked in green.
- MACD indicator (Moving Average Convergence / Divergence - moving average convergence / divergence) Fast EMA period 12. Slow EMA period 26. SMA period 9
- Bollinger Bands (Bollinger Bands). Period 20
