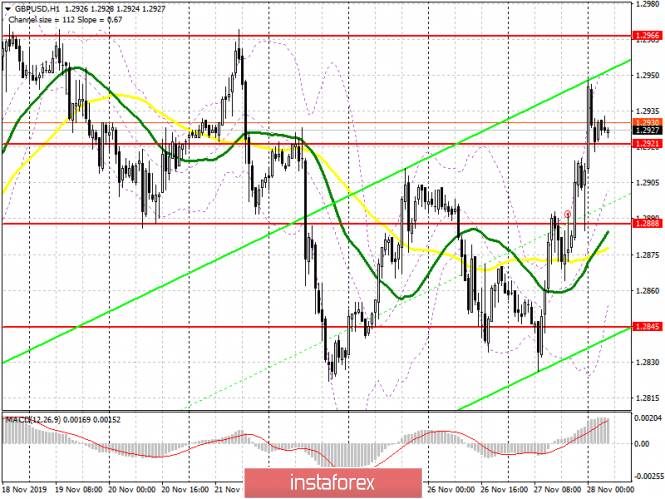
To open long positions on GBP/USD you need:
The British pound began to actively strengthen its position against the US dollar following news that the Conservative Party of Great Britain could win the election on December 12 this year by a good margin. Buyers managed to break above a number of resistances and at the moment, the main task is to maintain support at 1.2921, which is currently being traded. The formation of a false breakout at this level in the first half of the day will lead to further growth of GBP/USD to the highs of 1.2966 and 1.3017, where I recommend profit taking. Given that important data for the UK are not coming out today, the focus will continue on election news. In the event that the pair falls below the 1.2921 support, it is best to return to long positions to rebound from the 1.2888 area, or immediately buy the pound after a test of a low of 1.2845.
To open short positions on GBP/USD you need:
Sellers have serious problems, as the hope of a continued downward correction has evaporated along with yesterday's growth of the pound. At the moment, an important task will be the return and consolidation under the support of 1.2921, which may push the pound lower to the area of 1.2888, where I recommend profit taking, as in this range the bulls will try to build the lower boundary of the new rising channel. If the demand for GBP/USD persists in the morning, then it is best to count on sales only after a false breakout has formed in the support area of 1.2966, and you can open short positions immediately for a rebound from a high of 1.3017.
Signals of indicators:
Moving averages
Trading is conducted above 30 and 50 moving average, which indicates a reversal of the downward trend.
Bollinger bands
If the pound decreases, support will be provided by the lower boundary at 1.2860. A break of the upper boundary of the indicator in the region of 1.2950 will lead to a more powerful wave of growth for the pair.

Description of indicators
- Moving average (moving average determines the current trend by smoothing out volatility and noise). Period 50. The graph is marked in yellow.
- Moving average (moving average determines the current trend by smoothing out volatility and noise). Period 30. The graph is marked in green.
- MACD indicator (Moving Average Convergence / Divergence - moving average convergence / divergence) Fast EMA period 12. Slow EMA period 26. SMA period 9
- Bollinger Bands (Bollinger Bands). Period 20
