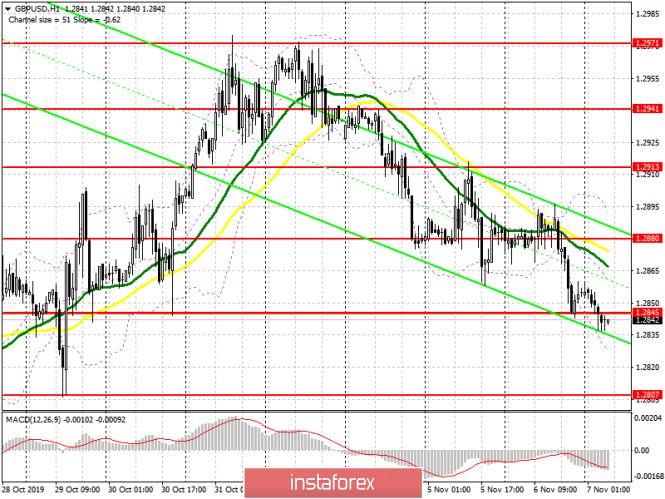
To open long positions on GBP/USD you need:
Today, much will depend on the forecasts of the Bank of England on the economy and inflation. Most likely the rate will remain unchanged, but expectations will be reviewed for the worse. Therefore, I do not recommend that you hurry with making pound purchases so far. The best option before the decision of the Bank of England would be to open long positions after updating support at 1.2807, with the condition of the formation of a false breakout there. Buying the pound immediately for a rebound is best done from the 1.2735 area. The bulls' task for the first half of the day will be to return to the resistance level of 1.2845, from which it will be possible to build a larger upward correction in the area of highs of 1.2880 and 1.2913, where I recommend profit taking.
To open short positions on GBP/USD you need:
The first signal to open short positions on the pound will be the formation of a false breakout in the resistance area of 1.2845, but a more important task will be to update the support of 1.2807, on which a lot depends. A breakthrough of this range can only occur after the publication of negative forecasts by the Bank of England on inflation and the UK economy, which will lead to the closure of a number of long positions in the pound and its decline to the low of 1.2735 and 1.2664, where I recommend profit taking. If sellers miss the resistance of 1.2845 in the morning, then it is best to count on sales after updating the high of 1.2880, subject to a false breakout, or immediately on a rebound from a large resistance at 1.2913, the update of which will indicate the formation of a new rising wave in GBP/USD.
Signals of indicators:
Moving averages
Trading is below 30 and 50 moving averages, which indicates a possible decline in the pound in the short term.
Bollinger bands
A break of the lower boundary of the indicator at 1.2828 will increase pressure on the pound. Growth will be limited by the upper level of the indicator at 1.2890.

Description of indicators
- MA (moving average) 50 days - yellow
- MA (moving average) 30 days - green
- MACD: Fast EMA 12, Slow EMA 26, SMA 9
- Bollinger Bands 20
