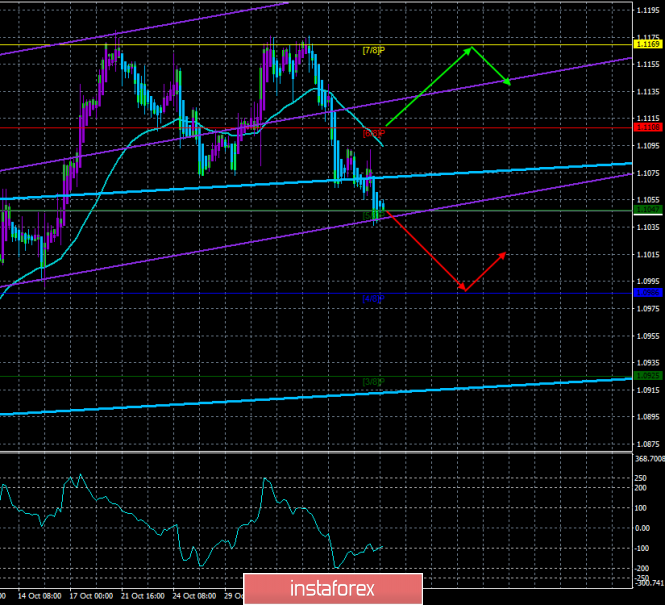
4-hour timeframe

Technical data:
The upper channel of linear regression: direction – upward.
The lower channel of linear regression: direction – upward.
The moving average (20; smoothed) – down.
CCI: -92.4955
The last trading day of the week. A week that could be the first in a series of a long fall cycle against the US currency. If you look at the 24-hour timeframe, you can see with the naked eye the graphic pattern "double top", which signals a reversal of the euro/dollar down. Accordingly, traders may well expect the fall of the euro currency to two-year lows, near which it was traded a few weeks ago. So far, the price has rested against Murray's level of "5/8" - 1.1047, which it could not overcome, but it seems that overcoming this target is a matter of time. The fundamental background continues to put pressure on the European currency. Any news from Europe is potentially downside factors for the euro. Data from the US upset traders much less often, so there is nothing logical in the growth of the dollar. Even yesterday, the seemingly secondary indicator of industrial production in Germany turned out to be such a failure value that traders had no other options but to resume selling the euro currency.
On Friday, November 8, Germany is scheduled to publish changes in the volume of imports, exports and trade balance for September. This is not even secondary indicators, but tertiary one. With a 95% probability, traders will not pay any attention to them. However, they will again show the state of the country's economy, which is considered to be the locomotive of the European economy. Another deterioration in Germany clearly will not add optimism to the bulls. In addition to news from Germany, we are waiting only for the University of Michigan consumer confidence index. It is also far from the most important indicator, which, moreover, will be released in the evening, when traders are preparing to leave for the weekend. Thus, we can assume that today is almost empty in terms of macroeconomic data. Towards evening, we can expect a movement against the trend that will develop during the day (it will probably be a downtrend), as market participants can begin to take profits on open positions. And since most of the positions in the pair are short now, the rollback is likely to follow upward.
Separately, we can talk about the long-term prospects of the euro currency paired with the dollar. What are the chances of the pair going below the current two-year lows? What global factors continue to influence the pair's movement? We believe that the chances of a new rally down are now quite high. Although a few weeks ago, the actions of the Fed gave reason to believe that the "dollar" trend has been completed. But the economy of the European Union is in such a weak state that few investors are willing to buy the euro currency among investors. Thus, the euro is now bought on the interbank market only when a major player needs to make payments in euros. Such transactions, especially if they are large, can also affect the movement of the pair. However, in general, the news for the European currency is very bad.
Nearest support levels:
S1 – 1.1047
S2 – 1.0986
S3 – 1.0925
Nearest resistance levels:
R1 – 1.1108
R2 – 1.1169
R3 – 1.1230
Trading recommendations:
The euro/dollar pair overcame the moving average and worked out the Murray level of "5/8". Since the Heiken Ashi indicator continues to paint the bars blue, there is no reason to close the sales. Thus, it is possible to stay in short positions with a target of 1.0986. It is unlikely that this goal will be achieved today when the fundamental background is empty. It is recommended to return to purchases of the European currency not earlier than the reverse consolidation of the pair above the moving average.
In addition to the technical picture, fundamental data and the time of their release should also be taken into account.
Explanation of the illustrations:
The upper channel of linear regression – the blue line of the unidirectional movement.
The lower channel of linear regression – the purple line of the unidirectional movement.
CCI – the blue line in the indicator window.
The moving average (20; smoothed) – the blue line on the price chart.
Support and resistance – red horizontal lines.
Heiken Ashi – an indicator that colors bars in blue or purple.
Possible variants of the price movement:
Red and green arrows.
The material has been provided by InstaForex Company - www.instaforex.com