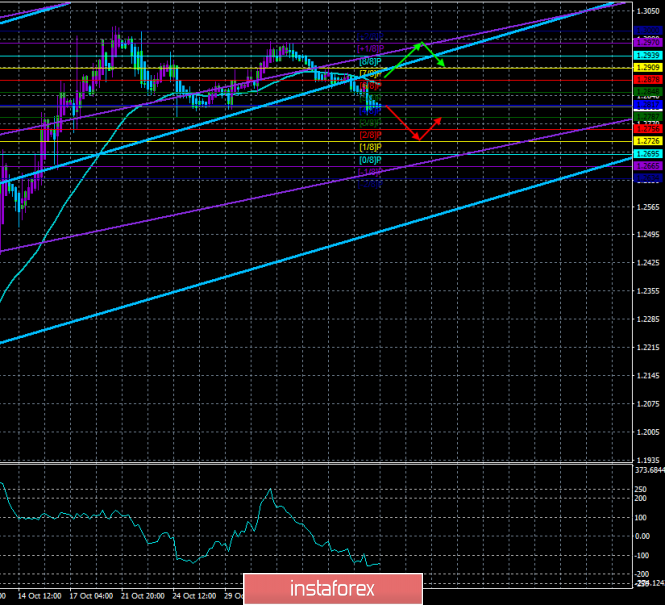
4-hour timeframe

Technical data:
The upper channel of linear regression: direction – upward.
The lower channel of linear regression: direction – upward.
The moving average (20; smoothed) – down.
CCI: -141.6137
The British pound paired with the US currency continues a slow decline. Both channels of linear regression are still directed upwards, which still signals a possible resumption of the upward trend at almost any moment. However, the fundamental background remains negative for the pair. The British currency has very few growth factors. Yesterday, for example, at the passing meeting of the Bank of England, it became clear that two members of the monetary committee voted for an immediate reduction in the key rate. This is the most bearish factor for the pound that could be. Now, it turns out that the easing of monetary policy by the British Regulator is a matter of time. If it could be assumed that shortly macroeconomic statistics in the UK will improve, then the probability of lowering the key rate would be 50/50. In our case, the questions arise, as the Bank of England did not take such a step much earlier? We have already said that most experts and traders agreed that there will be no change in monetary policy until there is clarity on the issue of Brexit. And until that moment, at least another month and a half, or even more. Accordingly, at the next meeting, the Regulator, led by Mark Carney, may not wait for a decision of the new Parliament on Brexit and decide to lower the rate. Thus, as in the case of the euro currency, there is now much more reason for the further fall of the British currency than for its growth. The upward movement of the pound/dollar pair may be justified in December or January when hypothetically the chances of the UK leaving the European Union with a "deal" will increase.
Today can be considered a day off for the British pound. Not a single macroeconomic report in the UK (we are even used to this), one minor publication in the United States. There is simply nothing to analyze. Well, traders, most likely, will not try to increase their activity, which leaves much to be desired in recent weeks. Thus, the pound will continue its sluggish downward movement with very low volatility, and at the end of the trading day, a small pullback up is possible for the same reasons as for the EUR/USD pair. But on Monday, from Foggy Albion, there will be a sufficient amount of macroeconomic statistics, which can "ride a skating rink" in British currency. Industrial production, GDP in monthly, quarterly and annual terms will be published. And guess what forecasts for these indicators? Negative. That is, it is expected that the quarterly and monthly value of GDP will decrease, and industrial production may lose 0.4%.
From a technical point of view, the indicator Heiken Ashi painted the last bars in blue, so there is no reason to close short positions now. The trend in the short term remains downward. The fundamental side of the issue also supports the continuation of the downward movement.
Nearest support levels:
S1 – 1.2787
S2 – 1.2756
S3 – 1.2726
Nearest resistance levels:
R1 – 1.2817
R2 – 1.2848
R3 – 1.2878
Trading recommendations:
The GBP/USD pair has settled below the moving average line and continues its weak downward movement. Formally, traders can consider selling the pound with targets of 1.2787, 1.2756, and 1.2726. However, we would not recommend doing this in large volumes, as both trend channels of linear regression remain directed upwards, and the volatility of the pair is now quite low. However, it remains more preferable to the downward movement of the pair in the coming days.
In addition to the technical picture, fundamental data and the time of their release should also be taken into account.
Explanation of the illustrations:
The upper channel of linear regression – the blue lines of the unidirectional movement.
The lower channel of linear regression – the purple line of the unidirectional movement.
CCI – the blue line in the regression window of the indicator.
The moving average (20; smoothed) – blue line on the price chart.
Support and resistance – red horizontal lines.
Heiken Ashi – an indicator that colors bars in blue or purple.
Possible variants of the price movement:
Red and green arrows.
The material has been provided by InstaForex Company - www.instaforex.com