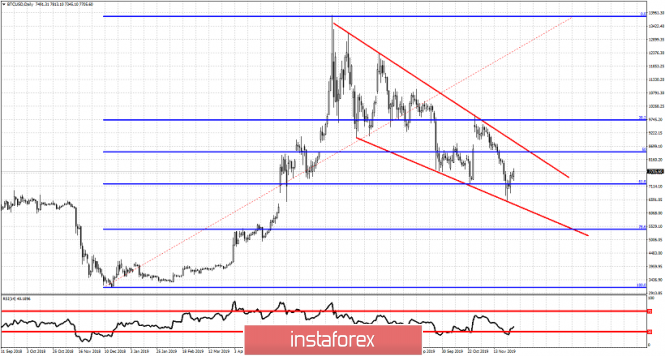
BTCUSD is bouncing inside a downward sloping wedge pattern. For another bullish trend to start we first need to see some signs of strength. BTCUSD must first exit the downward sloping wedge pattern and start making higher highs and higher lows.

Red lines - bullish wedge
Resistance by the wedge pattern is found at $8,800-$9,000 price level. The RSI on the Daily chart is turning upwards from oversold levels. Price has reached the 61.8% Fibonacci retracement of the entire bull wave of Bitcoin. The 61.8% Fibonacci retracement level is a very common area of trend reversals. So what bulls need now is to show more signs of strength. First break above the wedge pattern and then break above the latest important high. The $9,900 area is important resistance and a break above it will confirm trend change.
The material has been provided by InstaForex Company - www.instaforex.com