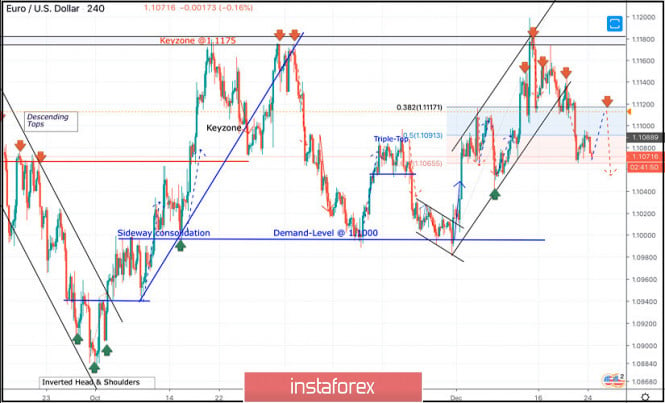
Since November 14, the price levels around 1.1000-1.0995 has been standing as a significant DEMAND zone which has been offering adequate bullish SUPPORT for the pair on two successive occasions.
Shortly-after, the EUR/USD pair has been trapped within a narrower consolidation range between the price levels of 1.1000 and 1.1085-1.1100 (where a cluster of supply levels and a Triple-Top pattern were located) until December 11.
On December 11, significant bullish swing was initiated around 1.1040 allowing recent bullish breakout above 1.1110 to pursue towards 1.1175 within the depicted newly-established bullish channel.
Intraday bearish rejection was expected around the price levels of (1.1175).
Quick bearish decline was demonstrated towards 1.1115 (38.2% Fibonacci level) which got broken to the downside as well.
On Friday, further bearish decline was demonstrated towards 1.1065 where early signs of bullish recovery is currently manifested.
Any bullish pullback towards 1.1115 should be watched for bearish rejection and another SELL entry.
On the other hand, If earlier bearish decline below 1.1065 is demonstrated, next bearish projection target would be located around 1.1010.
Trade recommendations :
Conservative traders should wait for a bullish pullback towards 1.1115 ( reversal pattern neckline ) as a valid SELL signal.
Bearish projection target to be located around 1.1090, 1.1040 and 1.1010.
The material has been provided by InstaForex Company - www.instaforex.com