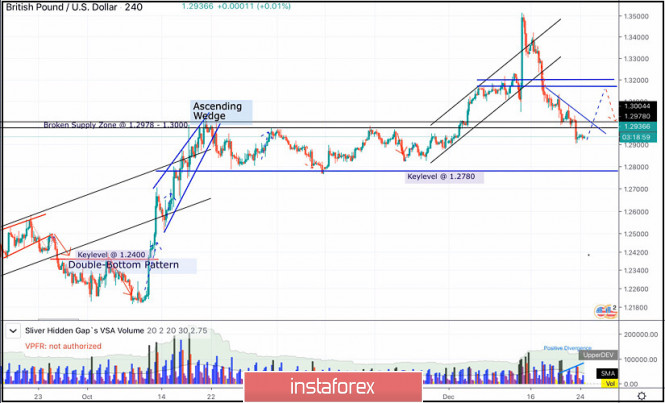
In the period between October 17 to December 4, the GBP/USD pair has been trapped between the price levels of 1.2780 and 1.3000 until December 4 when bullish breakout above 1.3000 was achieved.
Moreover, a newly-established short-term bullish channel was initiated on the chart.
The GBPUSD has recently exceeded the upper limit of the depicted bullish channel on its way towards 1.3500 where the pair looked quite overpriced.
This was followed by successive bearish-engulfing H4 candlesticks which brought the pair back towards 1.3170 quickly.
Further bearish decline was pursued towards 1.3000 which got broken to the downside as well.
Short-term outlook remains bearish as long as bearish persistence below 1.3000 is maintained on the H4 chart.
Further bearish decline is expected towards 1.2840 - 1.1800 provided that bearish persistence below the newly-established downtrend line is maintained ( Low Probability ).
However, early signs of bullish recovery as well as some positive divergence are being manifested on the chart denoting a high probability bullish reversal to be expected soon.
That's why, Intraday bullish pullback may be anticipated to occur towards 1.3170-1.3190 where bearish rejection and another bearish swing can be initiated.
The material has been provided by InstaForex Company - www.instaforex.com