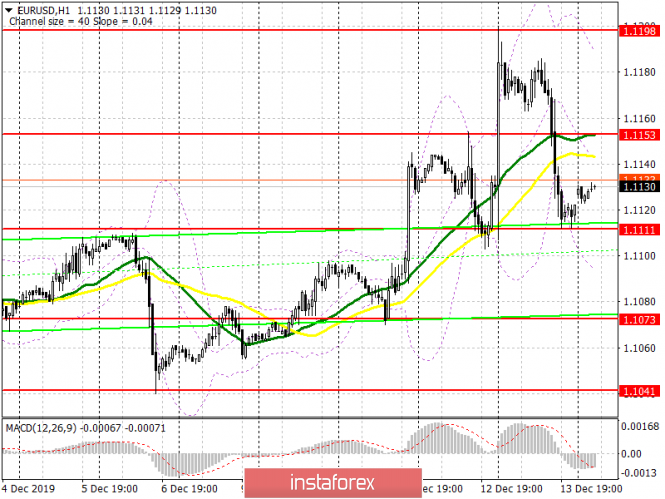
To open long positions on EURUSD, you need:
Friday's data on retail sales in the United States, although worse than economists' forecasts, but once again confirmed the fact that the economy continues to move on the path of growth. Now, buyers of the euro should count on the level of 1.1111, which I drew attention to my Friday's review. However, now, only the formation of a false breakout in the area of this range will be a signal to buy the euro. In the scenario of a breakout of 1.1111 in the first half of the day, after a weak report on the eurozone manufacturing sector, it is best to expect to buy from a minimum of 1.1073 or buy immediately on a rebound from 1.1041. The more important task of the bulls will be a breakthrough and consolidation above the resistance of 1.1153, which will lead to an upward correction in the area of the maximum of 1.1198, from where the euro sell-off began on Friday, where it is also recommended to take profits on long positions.
To open short positions on EURUSD, you need:
Sellers coped with the task and returned the pair to the support of 1.1111, which could not be broken the first time. At the moment, all the focus will be on this range, which can be passed after a weak report indicating further contraction of the eurozone manufacturing sector. A break of 1.1111 will open a direct road to the area of lows of 1.1073, and a more distant target of sellers will be the area of 1.1041, where I recommend fixing the profits. In the scenario of EUR/USD growth in the first half of the day above 1.1153, where I also recommend looking at short positions when forming a false breakout, it is best to count on selling from this month's maximum in the area of 1.1198 or sell even higher from 1.1226.
Indicator signals:
Moving Averages
Trading is below the 30 and 50 moving averages, which indicates the formation of a bearish market in the short term. The moving average test will also be a signal to open short positions in the euro.
Bollinger Bands
An unsuccessful consolidation above the average border of the indicator in the area of 1.1140 will be a signal to sell the euro. The downward movement can be limited to the lower level of the indicator in the area of 1.1095.

Description of indicators
- Moving average (moving average determines the current trend by smoothing volatility and noise). Period 50. The chart is marked in yellow.
- Moving average (moving average determines the current trend by smoothing volatility and noise). Period 30. The chart is marked in green.
- MACD indicator (Moving Average Convergence / Divergence - convergence / divergence of moving averages) - EMA Period 12. Slow EMA Period 26. SMA period 9
- Bollinger Bands (Bollinger Bands). Period 20
