To open long positions on EURUSD, you need:
The absence of important fundamental statistics leaves the euro in a narrow channel with low intraday volatility. Yesterday, the bulls retreated from the middle of the channel at 1.1127, which led to a breakout of this range and the formation of resistance at 1.1132. Today, the key task will be to return to this range, but in the first half of the day, in the absence of important fundamental statistics, it is unlikely to talk about a larger growth of EUR/USD in the area of the upper border of the side channel 1.1172. In case of unsuccessful consolidation above 1.1132, I recommend to postpone long positions until the minimum of 1.1090 is updated, and in the case of the larger drop in the euro, after data on the US economy, it is best to consider new purchases for a rebound from the area of 1.1041.
To open short positions on EURUSD, you need:
Sellers, showing minimal activity, managed to drag the euro at the level of 1.127 yesterday, which is now transformed into resistance 1.1132. It is this range that bears will protect today in the first half of the day, and the formation of a false breakout on it will be a signal to open short positions to reduce to the area of the lows of 1.1090 and 1.1041, where I recommend taking the profits. The absence of important fundamental statistics on the eurozone today in the first half of the day is unlikely to lead to sharp market jumps. If the pair grows in the first half of the day above the resistance of 1.1132, I recommend selling EUR/USD only on a rebound from the maximum of 1.1172, or after updating the monthly resistance around 1.1198.
Indicator signals:
Moving Averages
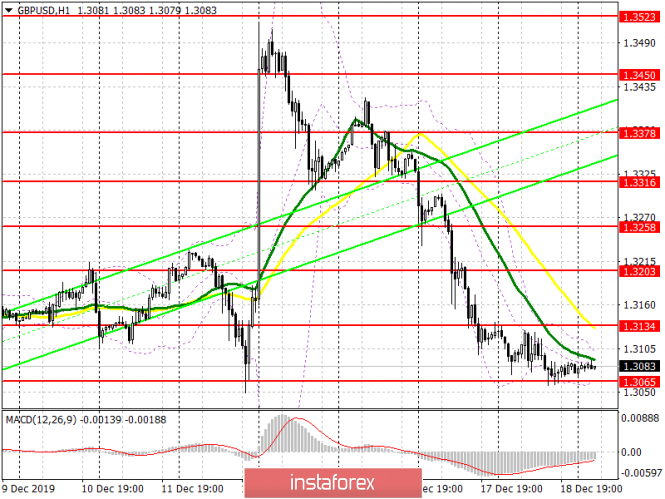
Trading is conducted in the area of 30 and 50 moving averages, which indicates the lateral nature of the market.
Bollinger Bands
Breaking the upper limit of the indicator around 1.1132 will lead to the growth of the European currency. The breakdown of the lower border, which coincides with the support of 1.1105, will increase the pressure on the euro.

Description of indicators
- Moving average (moving average determines the current trend by smoothing volatility and noise). Period 50. The chart is marked in yellow.
- Moving average (moving average determines the current trend by smoothing volatility and noise). Period 30. The chart is marked in green.
- MACD indicator (Moving Average Convergence / Divergence - Convergence / Divergence of moving averages) - EMA Period 12. Slow EMA Period 26. SMA Period 9
- Bollinger Bands (Bollinger Bands). Period 20
