To open long positions on EURUSD you need:
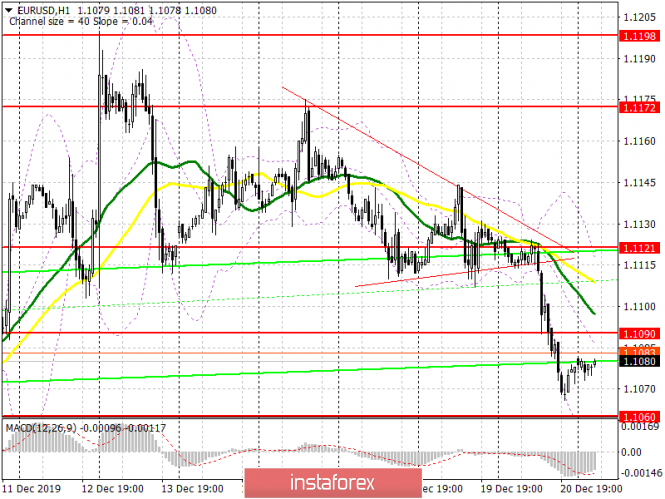
Euro sellers coped with the task and made their way below the lower boundary of the triangle, which I paid attention to in my past forecasts, causing the pair to fall. Good data on the growth of American incomes also supported the US dollar, preventing bulls from holding their positions at the lows of the week. Currently, all emphasis is shifted to data on Germany, and to the level of 1.1090, which now acts as a resistance. Consolidation above this range will lead to a larger upward correction to the area of a high of 1.1121, above which it will be quite difficult to break through. In case of preserving pressure on EUR/USD, it is best to return to long positions only for a rebound from support of 1.1060, subject to the formation of divergence on the MACD indicator, or from a larger low of 1.1041.
To open short positions on EURUSD you need:
Sellers will defend the resistance of 1.1090, and the formation of a false breakout there will be a direct signal to open short positions in continuing the downward trend in order to update the lows of 1.1060 and 1.1041, where bullish divergence can be formed on the MACD indicator, so I recommend taking profit there. In the absence of pressure on the euro in the region of 1.1090, it is best to postpone selling until the fundamental statistics on the US economy are released, namely, on the number of orders for durable goods, and open short positions immediately to rebound from a high of 1.1121, since a break above this level will negate all Friday's efforts of euro sellers.
Signals of indicators:
Moving averages
Trading is conducted below 30 and 50 moving averages, which will act as intermediate resistance for buyers today.
Bollinger bands
Growth can be limited by the upper indicator level in the region of 1.1110, while the lower boundary of the indicator in the region of 1.1060 will support.

Description of indicators
- Moving average (moving average determines the current trend by smoothing out volatility and noise). Period 50. The graph is marked in yellow.
- Moving average (moving average determines the current trend by smoothing out volatility and noise). Period 30. The graph is marked in green.
- MACD indicator (Moving Average Convergence / Divergence - Moving Average Convergence / Divergence). Fast EMA period 12. Slow EMA period 26. SMA period 9.
- Bollinger Bands (Bollinger Bands). Period 20.
