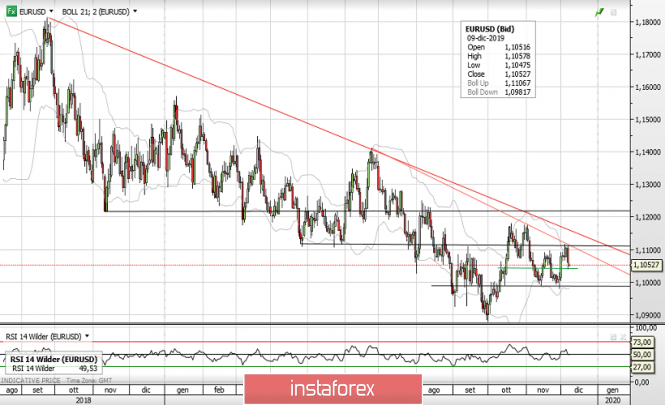
Below you can see the daily EUR/USD chart: it's quite a long term, but it is important to see from where we can draw a long term downtrend (Sept 2018) and where it is passing right now (around 1.1160); we can also see another dynamic resistance coming down from Jul2019 high and it has just been tested on Friday around 1.1020. This level is also being tested several times both as resistance and support from Apr of this year
USD gains ground amid the upbeat NFS report. Earlier, investors remained worried after the release of disappointing ISM and labour data. EUR/USD suffered losses the most on the last day of the week.

