EUR / USD
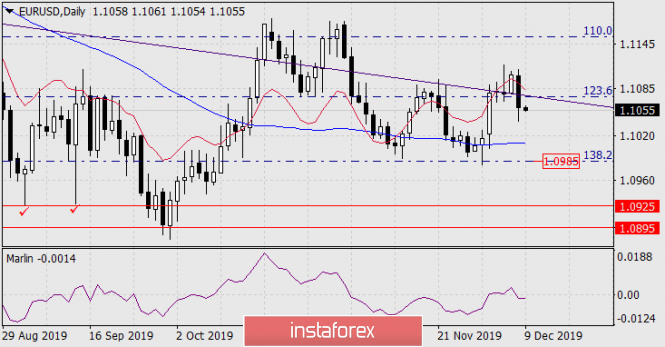
On Friday, the price returned to the Fibonacci level of 123.6% and under the embedded line of the declining blue price channel, due to excellent data on US employment. At the same time, the breakdown of support occurred exactly at the intersection of these two lines, which is a sign of strong movement, with prospects for further development. The signal line of the Marlin oscillator, in turn, returned to the downward trend zone.

The first target of the movement will be the Fibonacci level of 138.2% at the price of 1.0985. After that, breaking through this support from which the price turned up on November 29 and 14, will open lower targets: 1.0925 (lows of September 12 and 3) and 1.0895. As it moves further, the price will have to fight with the Fibonacci level of 161.8% at the price of 1.0845 and go down to the lower line of the blue price channel in the region of 1.0710.

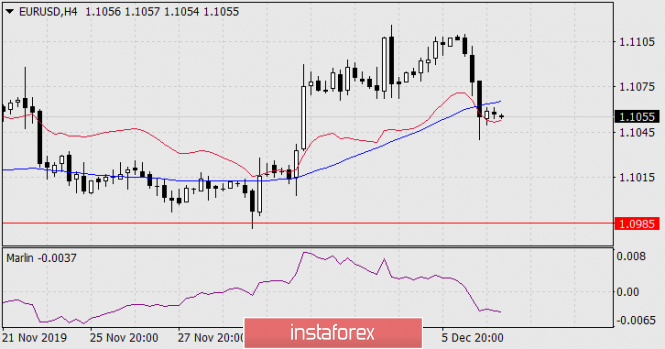
On the four-hour chart, the price has consolidated below the MACD line; the Marlin oscillator is completely in a downward trend.
The material has been provided by InstaForex Company - www.instaforex.com