USD/JPY
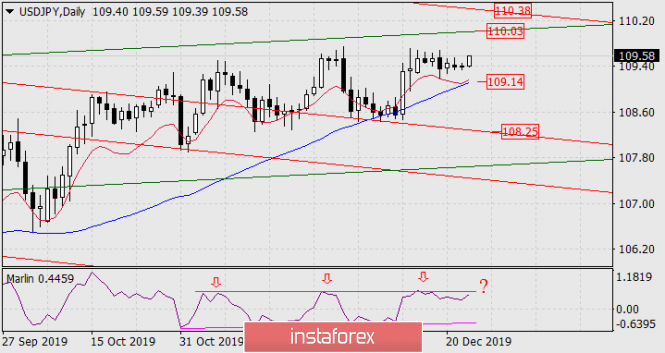
Today's growth of the USD/JPY pair has transformed the movement of the last seven daily candles into horizontal consolidation. This increases the likelihood of working out the green line of the price channel on the daily chart in the price area of 110.03. Overcoming resistance will open the second target of 110.38 - the line of the red price channel.

The triple peak on the Marlin oscillator is strong enough. The formation of the fourth peak is also possible, after which the indicator will unfold to go down (accordingly, the price). In fact, according to Marlin, a range is formed - a horizontal channel slightly converging on a wedge, which in the medium term retains the potential for a market decline - the signal line goes down from the wedge. A significant sign of a falling dollar will be the price drift below the MACD line on the daily, below 109.14. The target will be the line of the red price channel at around 108.25.

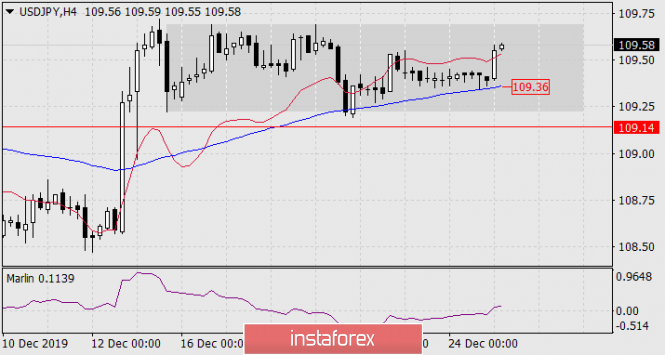
On the H4 chart, the consolidation from December 13 looks more pronounced. The MACD line is the support. Accordingly, consolidating the price under it (below 109.36) will be the first sign of an attack on 109.14 as well.
The material has been provided by InstaForex Company - www.instaforex.com