Hello again!
Taking advantage of the closure of markets due to the celebration of Christmas, it is possible to consider currency pairs that are usually deprived of attention. One of these pairs, in my opinion, is the pound/yen cross rate. Those who are not beginners are well aware that this is one of the most volatile crosses, trading with which, you can not only make good money, but also decently lose.
I admit honestly, recently I rarely look at the charts of this tool, and even more so, I trade it. It will be even more interesting right now in real time to consider further prospects of GBP/JPY by analyzing price charts.
Do you want to - believe it or not - I just opened a graph of this cross-pair, did not prepare for its analysis, so right now I will express my personal opinion on the basis of technical factors.
Weekly

It's no secret that both the pound and the Japanese yen have not shone the stable direction of price dynamics in recent years. Both currencies either show serious strengthening, or suddenly find themselves under no less serious pressure from sales.
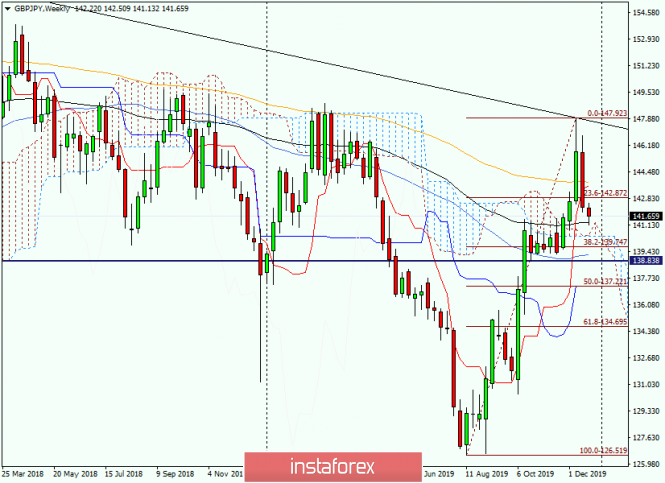
As you can see, the weekly chart perfectly confirms this interpretation. Following the impressive growth of 126.52-147.92, an equally significant decline began. However, by stretching the grid of the Fibonacci instrument to the indicated upward movement, the downward direction at the moment can be considered a correction to the previous growth. Nevertheless, the continuation of the downward dynamics and the breakout of the level of 138.84 will significantly aggravate the situation for bulls on GBP/JPY. It will be possible to finally talk about the bearish moods in the cross after passing the 50th level of Fibo from the indicated growth. It is characteristic that it is here that the Kijun line of the Ichimoku indicator runs, which makes the moment with the pair going down to 137.20 perhaps the key.
Key in terms of what comes next. If 50% Fibo and Kijun repel a possible bear attack, you can expect a rebound to at least 139.00-139.20. As you can clearly see on the weekly chart, below are many strong supports, the passage of which is by no means guaranteed.
At the moment, the bears are trying to push quotes below a strong 89 exponent. Whether they will succeed or not, we will find out only after the close of trading on December 23-27.
But even if 89 EMA is broken, below the support are able to provide both boundaries of the Ichimoku indicator cloud at 140.50, and at 139.25 50 a simple moving average.
As for me, the chances of a further direction of the price movement are approximately equal, but, in my personal opinion, the continuation of the upward scenario seems to be the most relevant. By the way, its confirmation will be the breakout of the Tenkan 144 EMA line and consolidation above the important technical level 144.00.
Daily

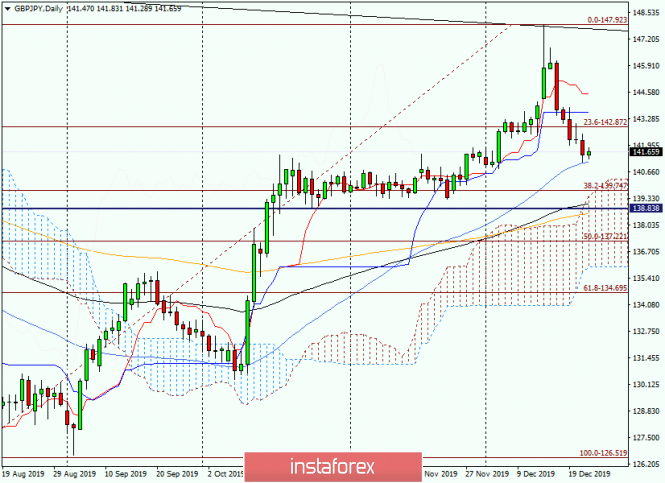
On the daily chart, the picture is also far from unambiguous. I will indicate the nearest resistance and support, after which traders are entitled to look for options for opening positions. I'll explain my point right away - it makes sense to consider movement and positioning in both directions.
So, selling looks relevant after quotes rise to 143.60 and 144.53. This is where the Kijun and Tenkan lines run, respectively. It seems that the price range of 143.50-144.50 is extremely strong and, together with Tenkan and Kijun, could provide strong resistance and turn the course down.
In turn, purchases are technically justified after a decline in the price range of 140.00-139.00. This is no less (or maybe more) strong area than the indicated resistance. With both options for positioning, it would be nice to enlist the support of candle signals. However, at the moment it is worth observing how the price behaves relative to 50 MA, which provides current support to the pound/yen cross.
Good luck and profit!
The material has been provided by InstaForex Company - www.instaforex.com