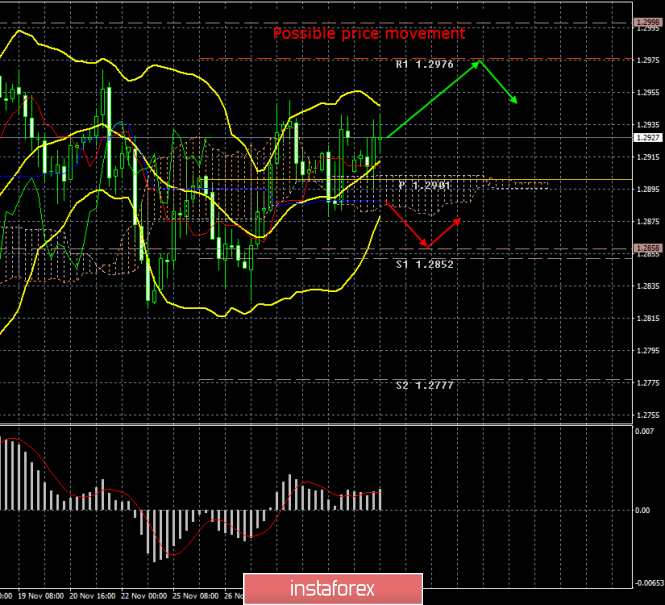
4-hour timeframe

Amplitude of the last 5 days (high-low): 78p - 69p - 89p - 52p - 63p.
Average volatility over the past 5 days: 70p (average).
The GBP/USD currency pair continues to trade inside the 200-point side channel and, while the euro/dollar pair has shown an impressive upward movement, continues to ignore any news and macroeconomic data. On the 4-hour chart, all the movements of the pair now look quite powerful. However, do not forget that the terminal automatically adjusts the scale of any instrument to the chart window. The real picture of things is more clearly visible on the 24-hour timeframe, where the flat catches your eye even from a kilometer distance. Despite the fact that today the pound/dollar pair has shown strengthening by as much as 50 points, we can not call this movement "strong" or "trending", or "the beginning of a new trend". We cannot ascertain the completion of a flat. We can only say that the traders of the currency pair continue to ignore any information that comes to their disposal, both the one regarding the confrontation between Conservatives and Labour, as well as the parliamentary elections in 2019, and the one that concerns the economy of Great Britain and the United States.
Markit published an index of business activity in the UK manufacturing sector today, December 2, which showed an improvement to 48.9 points. Yes, the value remains weak, but positive dynamics are also observed. US business activity indices can be considered weak, so the British currency could get the support of market participants today. However, instead, the currency pair continues to trade in a narrow range all day and still does not show any desire to break out of the side channel. A separate topic that must definitely be covered in the review is Donald Trump's introduction of duties on the import of aluminum and steel from Brazil and Argentina. This was announced by the President of the United States through his favorite means of communication with the people - Twitter. Trump accused the governments of these countries of deliberately devaluing their monetary units, which harms American farmers. Thus, Brazil and Argentina join China and Turkey. Trump also again called on Jerome Powell to lower the key rate, as "so many countries have stopped using our strong dollar, while continuing to devalue their currencies." Despite the fact that many currency pairs showed steady growth against the US currency today, we can't say that it was caused precisely by Trump's decisions to introduce duties against two more countries. Trump had previously imposed duties on Turkish imports, on Chinese (and more than once), and the US dollar had never reacted in this way. Thus, today the US dollar immediately fell (against many currencies, but not against the British pound) for a number of reasons. The British currency ignored all messages from Trump, and information about a new skirmish between Jeremy Corbyn and Boris Johnson after the attack on the London Bridge. Thus, traders can only wait for this nightmare to end. The euro was freed from the shackles of a flat today. In theory, the pound should be freed from them until December 13, inclusive.
The technical picture of the pound/dollar pair formally speaks in favor of continuing a weak upward movement, but in fact it continues an open flat, which does not make much sense to reject. Yes, the pair is located above all the lines of the Ichimoku indicator, but at any moment it can turn down. There was no sense at all about the fundamental background now, as traders ignore any incoming information, both economic and political. If market participants immediately drew attention to all economic publications over the past month, the pound would have fallen by 200-300 points.
Trading recommendations:
GBP/USD resumed its upward movement as part of a sideways trend. However, traders are not recommended to consider the purchase of the pound sterling now, since quotes fail to go beyond the level of 1.2970. Selling the pair now is also impractical from a technical point of view, since the price is located above all the lines of the Ichimoku indicator.
Explanation of the illustration:
Ichimoku indicator:
Tenkan-sen is the red line.
Kijun-sen is the blue line.
Senkou Span A - light brown dotted line.
Senkou Span B - light purple dashed line.
Chikou Span - green line.
Bollinger Bands Indicator:
3 yellow lines.
MACD indicator:
Red line and bar graph with white bars in the indicator window.
Support / Resistance Classic Levels:
Red and gray dotted lines with price symbols.
Pivot Level:
Yellow solid line.
Volatility Support / Resistance Levels:
Gray dotted lines without price designations.
Possible price movement options:
Red and green arrows.
The material has been provided by InstaForex Company - www.instaforex.com