To open long positions on GBP/USD you need:
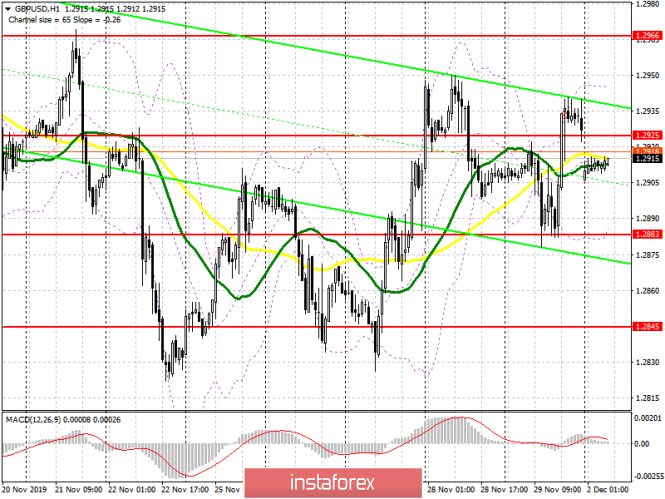
Buyers of the pound coped with the task last Friday and did not let the pair fall below the support of 1.2880. At the moment, due to the gap down, the bulls need to return the resistance of 1.2925, which will be the first signal to open long positions in the hopes of updating highs in the areas of 1.2966 and 1.3017, where I recommend profit taking. In case of a weak report on the UK manufacturing sector, in the first half of the day it will be possible to observe the pound's further fall to the support area of 1.2883, however it is best to open long positions from there after a false breakout is formed. I recommend buying GBP/USD immediately for a rebound only after a test of a low of 1.2845.
To open short positions on GBP/USD you need:
Following the overlap of the morning gap, pound sellers will try to regain market position, and a weak report on the decline in the UK manufacturing sector will lead to a false breakout in the resistance area of 1.2925, which will be the first signal to open short positions. The main goal of the bears will be to retest the level of 1.2883 and consolidate below this range, which will quickly push GBP/USD to the support area of 1.2845, where I recommend profit taking. In case the pair grows above the resistance of 1.2925 in the morning, it is best to return to short positions only for a rebound from a high of 1.2966. The main market movement will be formed only after the publication of regular opinion polls on the topic of general elections in the UK.
Signals of indicators:
Moving averages
Trade is conducted in the region of 30 and 50 moving average, which indicates the lateral nature of the market.
Bollinger bands
If the pound rises, sellers will try to restrain the pair from going above the upper boundary of the indicator at 1.2945, while the lower boundary at 1.2884 will provide support.

Description of indicators
- Moving average (moving average determines the current trend by smoothing out volatility and noise). Period 50. The graph is marked in yellow.
- Moving average (moving average determines the current trend by smoothing out volatility and noise). Period 30. The graph is marked in green.
- MACD indicator (Moving Average Convergence / Divergence - moving average convergence / divergence) Fast EMA period 12. Slow EMA period 26. SMA period 9
- Bollinger Bands (Bollinger Bands). Period 20
