To open long positions on GBPUSD, you need:
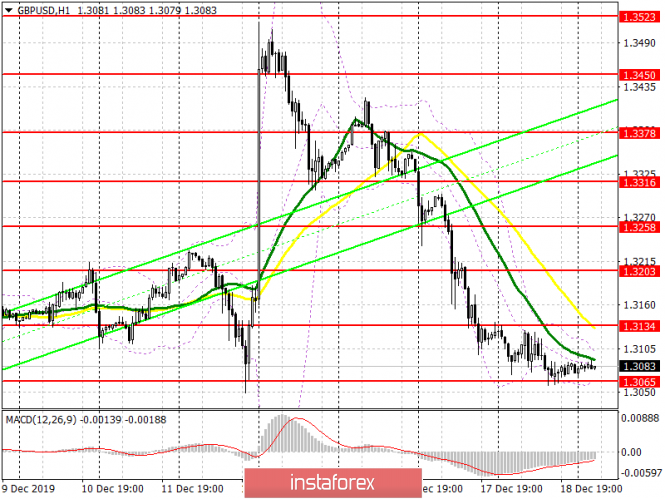
The pound remains in the side channel, preparing to make another jump down, but everything will depend on how many members of the committee will vote to lower the interest rate at this meeting. If the Bank of England does not change its policy course, it will lead to the strengthening of the pound, and the return to the resistance level of 1.3134 will be a signal to open long positions in the hope of updating the highs of 1.3202 and 1.3258, where I recommend taking the profits. If the pressure on GBP/USD persists after the regulator's decision, it is best to consider new long positions only after a false breakout in the area of 1.3065, or a rebound from the lows of 1.3010 and 1.2952.
To open short positions on GBPUSD, you need:
Sellers will wait for the results of the vote, and if more than two members of the committee vote in favor of reducing the interest rate, the Bank of England rate may change significantly, which will hit the positions of GBP/USD and lead to a breakthrough of the support of 1.3065, below which many stop orders of buyers of the pound are collected. Fixing below the level of 1.3065 will be a sell signal, which will lead the pair to update the supports of 1.3010 and 1.2952, where I recommend taking the profits. If the Bank of England refrains from changes in monetary policy, a breakthrough of 1.3134 will provide growth to the pound. In this scenario, it is best to consider new short positions after updating the highs of 1.3203 and 1.3258.
Indicator signals:
Moving Averages
Trading is conducted in the area of 30 and 50 moving averages, which indicates a possible end of the downward trend.
Bollinger Bands
Volatility has decreased, which does not give signals to enter the market.

Description of indicators
- Moving average (moving average determines the current trend by smoothing volatility and noise). Period 50. The chart is marked in yellow.
- Moving average (moving average determines the current trend by smoothing volatility and noise). Period 30. The chart is marked in green.
- MACD indicator (Moving Average Convergence / Divergence - Convergence / Divergence of moving averages) - EMA Period 12. Slow EMA Period 26. SMA Period 9
- Bollinger Bands (Bollinger Bands). Period 20
