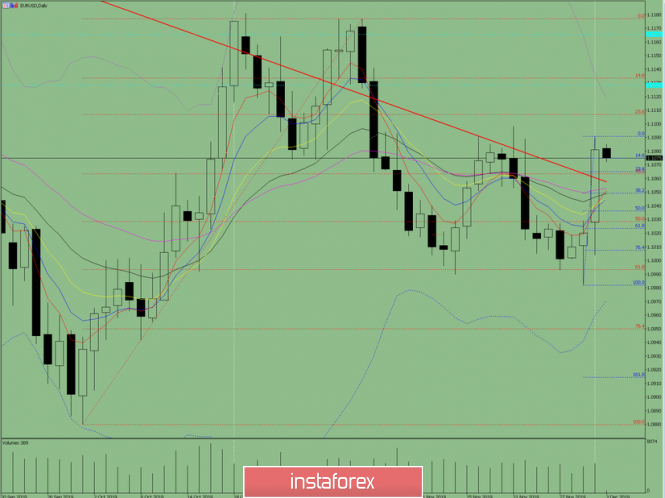
Trend analysis (Fig. 1).
On Tuesday, the first lower target is a pullback level of 23.6% which is equivalent to 1.1065 presented in a blue dashed line. If successful, the next lower target 1.1049 is the retracement level of 38.2% presented in a blue dashed line. From the level of 1.1049, we can expect upper work with the target of 1.1091, the upper fractal presented in a blue dashed line.

Fig. 1 (daily chart).
Comprehensive analysis:
- Indicator analysis - down;
- Fibonacci levels - down;
- Volumes - down;
- Candlestick analysis - down;
- Trend analysis - up;
- Bollinger Lines - up;
- Weekly schedule - up.
General conclusion:
On Tuesday, a pullback downward movement is possible.
The first lower target is the retreating level of 23.6% equivalent to 1.1065, presented in a blue dashed line. If successful, the next lower target 1.1049 is a retracement level of 23.6% presented in a blue dashed line. From the level of 1.1049, we can expect upper work with the target of 1.1091, the upper fractal in a blue dashed line. If the price does not fall below 1.1049, then we open up the market.
An unlikely, but possible scenario is a price fall down to a pullback level of 50% which is equivalent to 1.1037, presented in a blue dashed line.
The material has been provided by InstaForex Company - www.instaforex.com