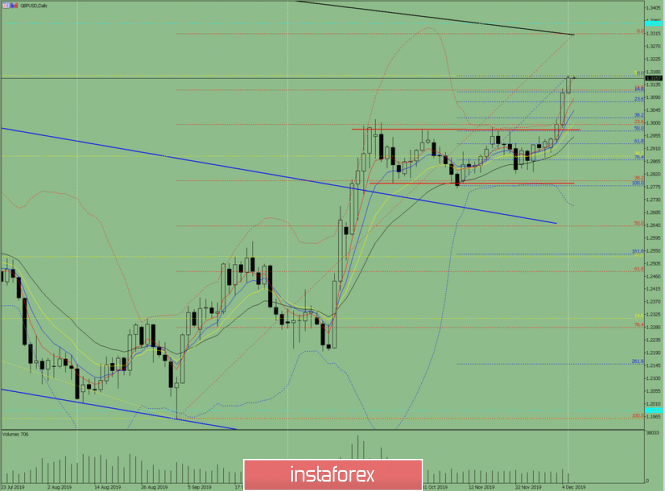
Trend analysis (Fig. 1).
On Friday, with the news headlines, the price can continue to move up with the target at 1.3311, the resistance line in black bold line and upon reaching this level, start a retreat downward with the first target 1.3116 the pullback level of 14.6% presented in a red dashed line.
On Friday, the price may work down with the target of 1.3310 a pullback level of 14.6% presented in a blue dotted line, and then a continuation of the upper movement.

Fig. 1 (daily chart).
Comprehensive analysis:
- Indicator analysis - up;
- Fibonacci levels - up;
- Volumes - up;
- Candlestick analysis - down;
- Trend analysis - up;
- Bollinger Lines - up;
- Weekly schedule - up.
General conclusion: upward movement.
On Friday, the price can continue to move up with the target at 1.3311 the resistance line in a black bold line and, upon reaching this level, start a retreat downward with the first target 1.3116 which is a pullback level of 14.6% presented in a red dashed line.
On Friday, the price may work down with the target of 1.3310 which is a pullback level of 14.6% presented in a blue dotted line. And then after, the continuation of the upper movement.
The material has been provided by InstaForex Company - www.instaforex.com