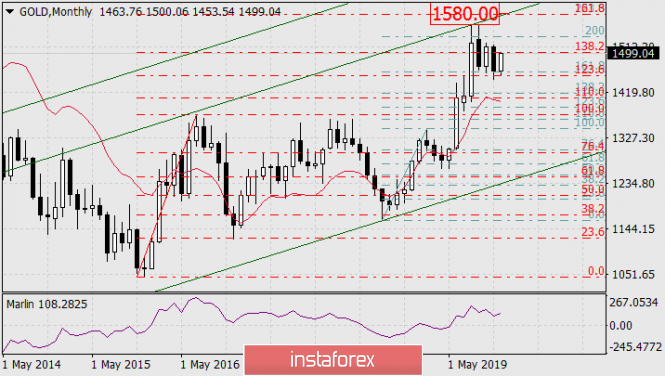
On a monthly chart, the current candle is growing exactly from the Fibonacci line 123.6% red. This grid is built on the base movement of December 2015-June 2016. The signal line of the Marlin oscillator also moved up in the zone of positive numbers.

A promising growth target is the level of coincidence of two Fibonacci levels: 161.8% of the red mesh and 223.6% of the azure mesh, the base branch of August 2018-February 2019. The levels coincide in the area of the price mark of 1580.00. In the same area, the price is waiting for the embedded line of the global price channel, originating in June 2005. The price can reach the target level in two months, that is, by March of next year.

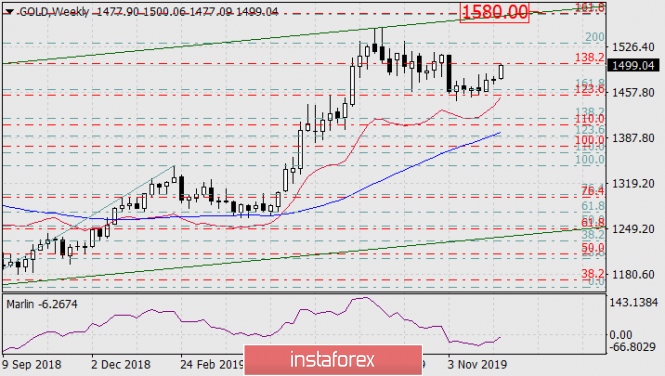
On the weekly chart, the price is showing steady growth, supported by the rising signal line of the Marlin Oscillator.

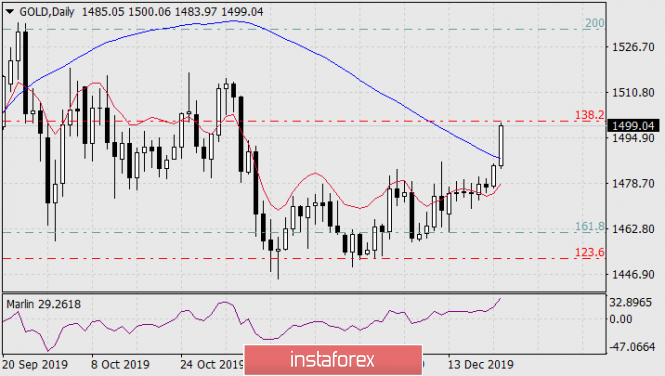
On the daily chart, the price went above the MACD line (blue moving), the signal line of the Marlin oscillator went out into the growth zone even earlier, now the situation on this scale is completely increasing.
The material has been provided by InstaForex Company - www.instaforex.com