USD/CAD
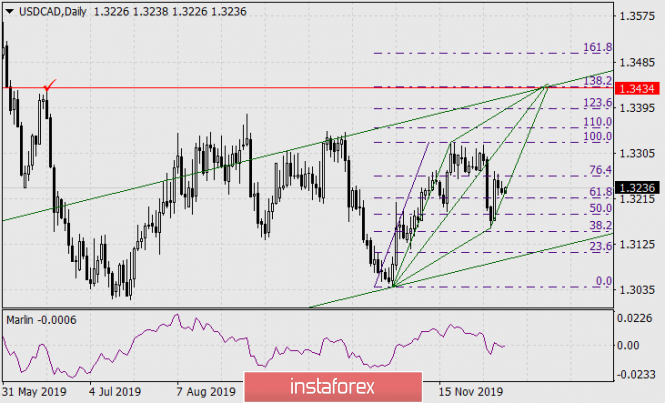
The signal line of the leading indicator Marlin went above the zero line (0.00) in the daily chart - into the zone of positive values. This is an occasion to take a closer look at the purchase and at the target level.

The Fibonacci grid points to a promising level of 1.3434 - this is the coincidence of the reaction level of 138.2% with the June 18 peak.
The classic rhombus along the first two branches of the loonie's movement forms a perspective convergence of the lines also at the level of 1.3434. There is an embedded line of the rising price channel at the same point, starting from the September 2017 low. The intersection of the lines form the date of December 22, but taking the weekends into account, the price will reach the target level exactly by the new year.
# ATT - telecommunication company AT&T
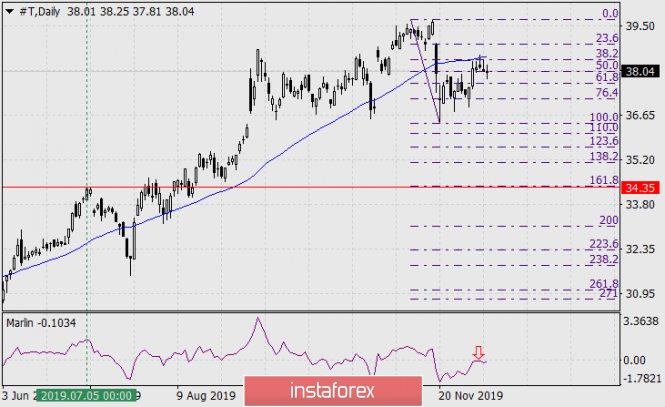
In November, the American telecommunications company AT&T sold a 42% stake in the Japanese company GSN Sony (The Game Show Network), which allowed the Japanese giant to penetrate into the cable and gaming space in the United States. From that moment, AT&T shares began to fall from the November 18 peak.

After reaching a local low at 36.39 on November 20, the price corrected by 61.8%, where it met resistance by the MACD indicator trend line. The price turned down from it simultaneously with the reversal of the signal line of the Marlin oscillator from the boundary with the growth territory. The downward trend. We are waiting for the price in the region of the Fibonacci reaction level of 161.8% at the price of 34.55. This target level coincides with the peak on July 5, 2019 and is close to peaks on October 5 and September 24, 2018.
The material has been provided by InstaForex Company - www.instaforex.com