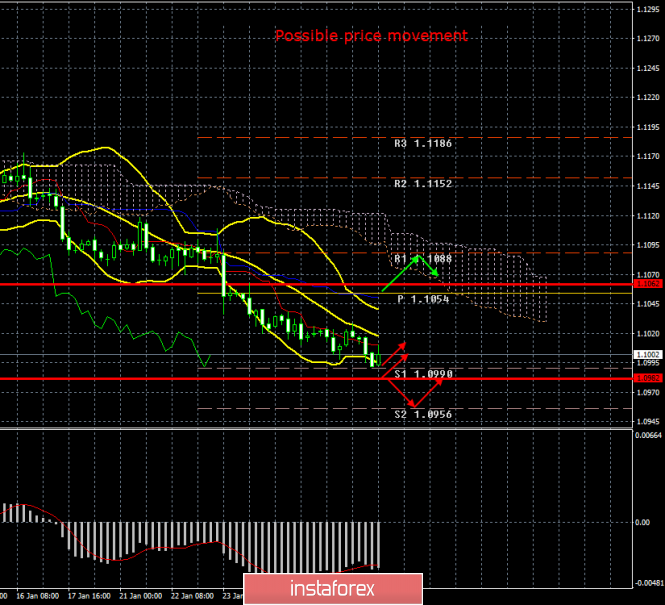
4-hour timeframe

Amplitude of the last 5 days (high-low): 28p - 73p - 42p - 28p - 28p.
Average volatility over the past 5 days: 40p (average).
The third trading day of the week ends the same as the previous two - a sluggish, calm, low-volatility downward movement. There were certain hopes for increased volatility or for the beginning of an upward correction yesterday, when sufficiently important data on orders for durable goods were published in the United States. However, by the end of the day, we can say that the volatility remained low (28 points), and instead of the correction there was only one name. Today, the euro/dollar pair has reached the level of 1.0990, which it has not yet managed to overcome. As we said earlier, such a weak movement can be very long and recoilless. Thus, it is possible that it will continue today without any gain. Although we are waiting for an extremely important event in its name in the evening, which, most likely, will become completely passing. This is the Fed meeting, and it is on it that we will dwell in more detail, since no other macroeconomic events have been planned to date.
With a probability of 99%, the Fed meeting will end with rates remaining unchanged. Thus, the monetary policy parameters will remain unchanged. In these parameters, one should take into account not only the Fed's key rate, but also the volume of monthly asset buybacks from the open market, which the Fed itself prefers not to mention, not to call them a "quantitative easing program", and when questions are asked, answer repurchase of short-term bills in order to ensure stable liquidity of the financial sector. A very convenient interpretation, which can be used in almost any action of the Fed. In fact, this means that the Fed stimulates the US economy every month in the amount of $60 billion. This program began in the fall of 2019, and in the first months it really seemed that this was a short-term measure. However, January is already ending, and no statements have been received on the completion of this program on the markets. Thus, in fact, we are dealing specifically with the QE program.
Furthermore, in light of the fact that the Fed has been stimulating the US economy with money for at least four months, this means that this very economy needs such stimulation. We mentioned earlier that the main indicators that cause the most concern are industrial production, GDP, and business activity in the manufacturing sector. It seems that the Fed also shares these concerns of traders and investors, but does not want to sow panic and to announce a resumption of the quantitative stimulus program. As you can see, this is very good for the US dollar. Because if Jerome Powell announced the restart of the quantitative easing program, then a wave of disappointment would certainly have swept the dollar bulls. However, in the light of this information, it is worth asking a question whether the US economy will slide into the same recession in the coming months of the second half of 2019 and because of which the asset repurchase program was resumed and the key rate was reduced three times. If so, then the prospects for the US currency are becoming more vague than just a few months ago. Recently, we regularly said that the US economy looks much stronger than the European one in the eyes of investors. This fact remains so. However, if the US economy shrinks at a faster pace than the European, which is now more in stagnation, then sooner or later it will catch up with it. Sooner or later, the Fed will start lowering the rate again, and everyone will understand that "monthly repayment of short-term bills" is not just a solution to short-term liquidity tasks, but a full-scale support for the economy, which, accordingly, is experiencing problems.
In general, it will be of great importance what exactly Powell will say today and what the Fed's accompanying statement will be. I also recommend paying attention to the conformity of what Powell said with the real picture of things, because if the Fed chairman says that the industrial sector is doing well, then there will be much less reason to trust his words. In fact, changes in the rhetoric towards the dovish may mean that the US economy may require more serious incentives in the near future. And also the fact that the loud signing of the first phase of the trade deal with China so far has not had any positive impact on the US economy. Have you noticed how sharply the criticism of Trump towards the Fed and Jerome Powell ended?
Trading recommendations:
EUR/USD continues to move down. Thus, it is recommended to hold open short positions with the targets of 1.0990, 1.0982 and 1.0956, until the start of the correctional movement (rebound from any target or MACD indicator upward with a parallel increase in price). It will be possible to consider purchases of the euro/dollar pair no earlier than traders of the Kijun-sen line are traded in small lots with the goals of resistance level 1.1088 and Senkou Span B. line
Explanation of the illustration:
Ichimoku indicator:
Tenkan-sen is the red line.
Kijun-sen is the blue line.
Senkou Span A - light brown dotted line.
Senkou Span B - light purple dashed line.
Chikou Span - green line.
Bollinger Bands Indicator:
3 yellow lines.
MACD indicator:
Red line and bar graph with white bars in the indicators window.
Support / Resistance Classic Levels:
Red and gray dashed lines with price symbols.
Pivot Level:
Yellow solid line.
Volatility Support / Resistance Levels:
Gray dotted lines without price designations.
Possible price movements:
Red and green arrows.
The material has been provided by InstaForex Company - www.instaforex.com