To open long positions on EURUSD you need:
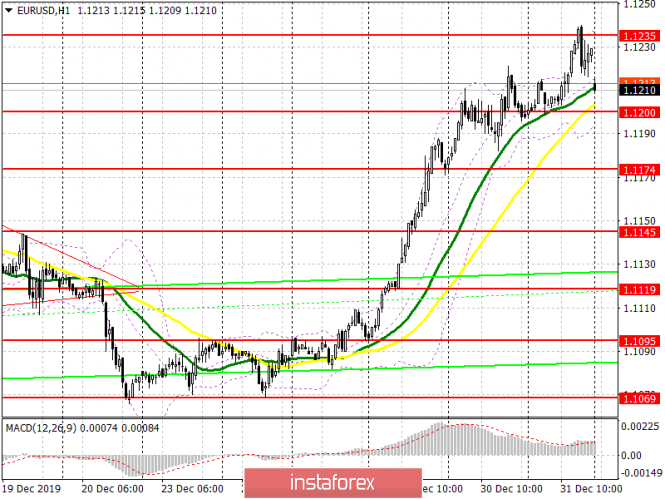
Nothing has changed from a technical point of view, another unsuccessful attempt to increase bulls above the resistance of 1.1235 led to a downward correction of the pair. At the moment, the closest target for buyers of the European currency is still the level of 1.1235, a breakthrough of which will provide the pair with a more powerful momentum, with a high at 1.1263 and 1.1289, where I recommend taking profits. If there are no active purchases of the euro in the first half of the day, it is best to postpone long positions to the test level of 1.1200, the formation of which a false breakout will be a signal to open long positions. Larger sellers will be active only in the area of a low of 1.1174.
To open short positions on EURUSD you need:
Data on manufacturing activity in the eurozone countries may put pressure on the euro in the morning, however, the whole emphasis will be shifted to support at 1.1200, since only consolidating below this level will lead to a downward movement to the low of 1.1174 and 1.1145, where I recommend taking profits. If the reports indicate the appearance of activity at the end of last year, then we can expect a second wave of EUR/USD growth in the resistance area of 1.1235, where the formation of a false breakout will be a signal to open short positions in the pair. I recommend selling the euro immediately for a rebound from a high of 1.1263.
Signals of indicators:
Moving averages
Trading is carried out in the region of 30 and 50 moving average, which can provide support to the pair in the short term.
Bollinger bands
If the pair decreases, support will be provided by the lower boundary of the indicator in the region of 1.1190. The upper boundary of the indicator in the area of 1.1235 will act as resistance, a break through which will lead to an increase in the euro.

Description of indicators
- Moving average (moving average determines the current trend by smoothing out volatility and noise). Period 50. The graph is marked in yellow.
- Moving average (moving average determines the current trend by smoothing out volatility and noise). Period 30. The graph is marked in green.
- MACD indicator (Moving Average Convergence / Divergence - moving average convergence / divergence) Fast EMA period 12. Slow EMA period 26. SMA period 9
- Bollinger Bands (Bollinger Bands). Period 20
