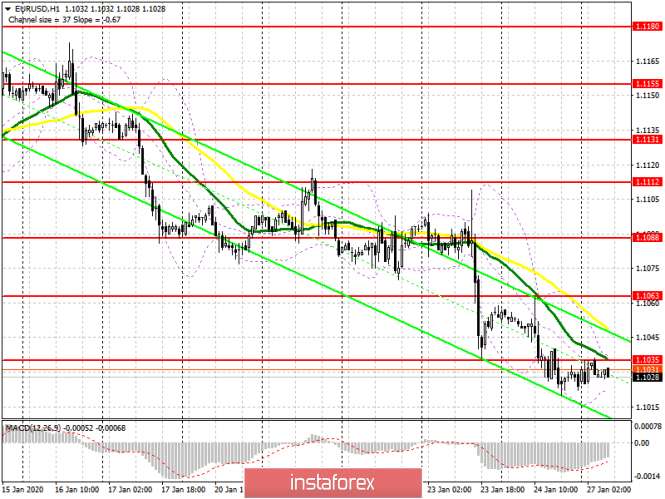
To open long positions on EURUSD you need:
Euro buyers will expect a return of resistance at 1.1035, which may coincide with the release of the Ifo report on the business environment indicator, providing bulls with confidence after Friday's divergence, which was formed on the MACD indicator. Consolidation above 1.1035 will lead to an upward correction to the area of 1.1063 and 1.1088, where I recommend taking profit. In the event of EUR/USD decline in the morning, and this option is possible only on condition of weak reports, it is best to look at long positions after updating support at 1.1004 or buy immediately on the rebound from the lows 1.0982 and 1.0964.
To open short positions on EURUSD you need:
Despite all the efforts of the bulls, the euro sellers managed to keep the market on their side last Friday. Today, the bears need to keep the pair below the level of 1.1035, and the formation of a false breakout together with the Ifo report will only increase the pressure on the pair, which will maintain a downward trend and lead to an update of the lows 1.1004 and 1.0982, where I recommend taking profit. If market activity in the direction of euro sales does not follow even after weak data from the German institute, then in this case I recommend that you postpone short positions in EUR/USD until an update of resistance at 1.1063 or sell immediately for a rebound from a high of 1.1088.
Signals of indicators:
Moving averages
Trade is conducted below 30 and 50 moving average, which indicates the preservation of the market on the side of sellers.
Bollinger bands
A break of the upper boundary of the indicator in the region of 1.1035 will lead to a sharp increase in the euro, while the downward trend may be limited in the area of the lower level of the indicator in the area of 1.1015.

Description of indicators
- Moving average (moving average determines the current trend by smoothing out volatility and noise). Period 50. The graph is marked in yellow.
- Moving average (moving average determines the current trend by smoothing out volatility and noise). Period 30. The graph is marked in green.
- MACD indicator (Moving Average Convergence / Divergence - Moving Average Convergence / Divergence). Fast EMA period 12. Slow EMA period 26. SMA period 9.
- Bollinger Bands (Bollinger Bands). Period 20.
