To open long positions on EURUSD you need:
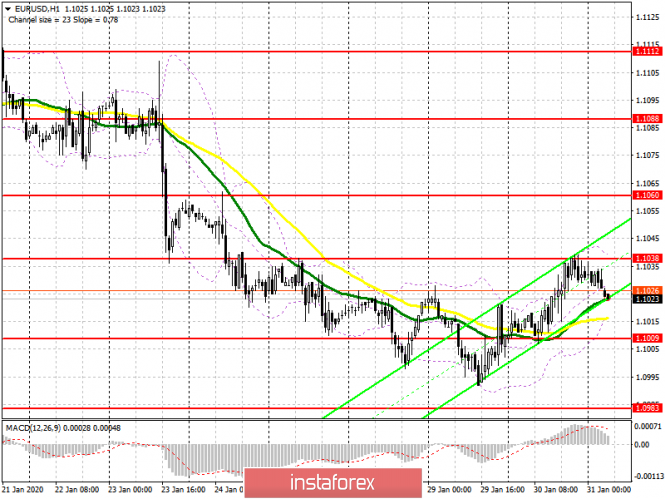
Yesterday, the bulls launched an attack of level 1.1030, but nothing good came of it. On the other hand, it's already a good thing that they stayed above 1.1010. Volatility is quite low and plays on the side of euro buyers so far . Today, buyers need good inflation in the eurozone, which is projected to grow, which will lead to a breakthrough and consolidation above the resistance level of 1.1038 and strengthen the bullish momentum, which is aimed at the level of 1.1060, where I recommend taking profit. It would also be nice to get good data on eurozone GDP growth for the fourth quarter of this year. In case the euro declines, support will be provided by the 1.1009 area, but opening long positions from there would be best provided that there is a false breakout, since breaking through this range will lead to a break in the upward correction and return new sellers to the market. In this case, I recommend looking for purchases of EUR/USD only after updating the lows around 1.0983 and 1.0964.
To open short positions on EURUSD you need:
Sellers are in no hurry to return to the market, but serious demand for the euro is also not observed. Today, the task of the bears will be to form a false breakout in the resistance area of 1.1038, and poor data on inflation in the eurozone will quickly push the euro to support 1.1009, on which the further direction of the market depends. Consolidating below this range will increase pressure on EUR/USD, which will open a direct path to the area of levels 1.0983 and 1.0964, where I recommend taking profits. If the bullish scenario I mentioned above is realized, then you can count on short positions after the breakout of resistance 1.1038 only from a high of 1.1060. Good data on the income and expenses of Americans are unlikely to seriously affect the technical map in the afternoon.
Signals of indicators:
Moving averages
Trade is carried out in the region of 30 and 50 moving average, but the advantage remains on the side of buyers of the euro.
Bollinger bands
A break of the upper boundary of the indicator in the region of 1.1038 will lead to an increase in demand for the euro. A break of the lower boundary at 1.1009 will increase the pressure on the pair.

Description of indicators
- Moving average (moving average determines the current trend by smoothing out volatility and noise). Period 50. The graph is marked in yellow.
- Moving average (moving average determines the current trend by smoothing out volatility and noise). Period 30. The graph is marked in green.
- MACD indicator (Moving Average Convergence / Divergence - moving average convergence / divergence) Fast EMA period 12. Slow EMA period 26. SMA period 9
- Bollinger Bands (Bollinger Bands). Period 20
