USD/JPY
Stock indices of the US market continue to set new records, along with them are rising Japanese indices and the USD/JPY pair. Yesterday, the S&P 500 grew by 0.70%, while the Nikkei 225 is adding a comparable 0.73% today. The China A50 Chinese stock index is up 0.40%, obviously, awaiting tomorrow's signing of the first part of a trade agreement with the United States. The United States also excluded China from the list of currency manipulators. Also, US corporate reports for the fourth quarter of 2019 are starting, forecasts are optimistic. Today, the largest banks are set to report: Citigroup (earnings forecast of $1.84 per share versus $1.61 in the third quarter), JPMorgan Chase & Co (forecast of $2.34 versus $1.98 earlier), Wells Fargo ($1.12 versus $1.21, but also good). Market growth may continue.

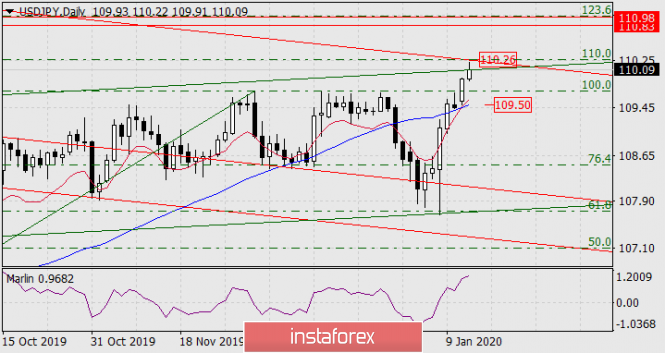
So, if the price goes above the resistance of the red line of the price channel, we are waiting for the price in the target range of 110.83/98 formed by the extreme on November 27, 2017 and February 11, 2016. Here is the Fibonacci level of 123.6% of the growth branch from August 26 to December 2. The indicated trend line (110.26) is the upper limit of the downward price channel originating in August 2015, this is its important - overcoming the line can trigger the pair's growth by another order of two or three figures. The strength of the channel boundary is supported by the Fibonacci level of 110.0%.

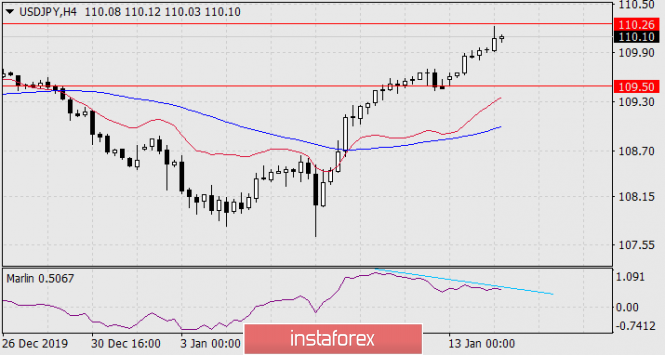
On the four-hour chart, the Marlin forms a divergence, perhaps before attacking the upper boundary of the price channel, the price will subside to the support of the MACD line on daily (109.50).
The material has been provided by InstaForex Company - www.instaforex.com