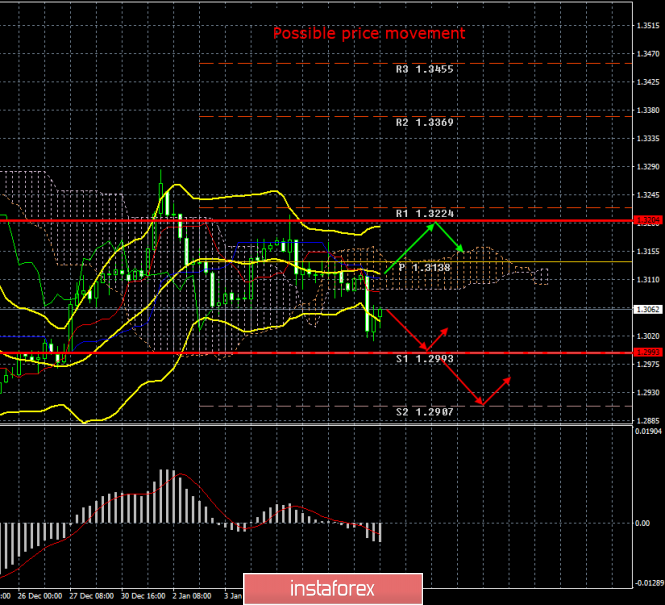
4-hour timeframe

Amplitude of the last 5 days (high-low): 135p - 106p - 111p - 118p - 89p.
The average volatility over the past 5 days: 112p (high).
The British pound on Thursday, January 9, plunged during the European trading session, after which it quickly came to its senses. Thus, at the moment, we can say that the flat is canceled, since the price has already overcome the lower Bollinger band, and the indicator itself can now begin to expand down. We believe that the general fundamental background remains in favor of the US dollar, despite the US military conflict with Iran, which, according to the latest information, is actually gradually disappearing. We still believe that the pound should "repay all debts" to the US currency for unreasonable growth to the level of $1.35. Moreover, macroeconomic statistics from the UK continues to leave much to be desired, the future of the country is still shrouded in fog, and European Commission President Ursula von der Leyen, after the first conversation with Boris Johnson, said that it would take much more than a year to sign a comprehensive agreement. In principle, these words can be regarded as a hint to Johnson that he should not count on the accelerated work regime of the European Union in order to catch up by December 31, 2020. Thus, the issue of signing a trade deal between London and Brussels is a very subtle one.
Meanwhile, the head of the Bank of England, Mark Carney, made a speech today. In the morning we talked about how long it was time for the British regulator to intervene in the country's economy, as macroeconomic indicators continued to fall. We also expected that Carney would open the veil over the plans of the Bank of England regarding monetary policy. Fortunately for traders, the central bank chief did not once again evade answers to direct questions with general phrases. He clearly stated that if the economy continues to slow down, the central bank will reduce the key rate. It is not clear how long and how much the British economy must slow down before the BoE intervenes. However, Carney indirectly answered this question, noting that the central bank does not have much space for influencing the economy through monetary policy and rates. The current rate is 0.75%, so the central bank can lower the rate 2-3 times, but clearly does not want to bring it to zero or a negative value. Carney also noted that the BoE could also expand its asset repurchase program. At the same time, market participants still do not expect monetary policy easing at a meeting on January 30. Carney is set to leave his post in March 2020 and seems to do the same as Mario Draghi - lower his key rate at his last or penultimate meeting. In our opinion, this will be a wise decision, since you must first wait for the beginning of the transition period of Brexit. This is precisely what the British regulator has regularly hinted at in recent months - the uncertainty of the consequences for the economy at a time when Brexit will begin.
Thus, the GBP/USD currency pair may resume a downward trend, as most technical and fundamental factors speak in favor of this.
Trading recommendations:
GBP/USD overcame the Ichimoku cloud and resumed its downward movement. Thus, it is recommended that traders continue to trade lower with the target of the support level of 1.2993 (which coincides with the lower boundary of the volatility channel on January 9). It is recommended that purchases of British currency be returned no earlier than when the price is consolidated above the Kijun-sen line with the first target level of 1.3204.
Explanation of the illustration:
Ichimoku indicator:
Tenkan-sen is the red line.
Kijun-sen is the blue line.
Senkou Span A - light brown dotted line.
Senkou Span B - light purple dashed line.
Chikou Span - green line.
Bollinger Bands Indicator:
3 yellow lines.
MACD indicator:
Red line and bar graph with white bars in the indicators window.
Support / Resistance Classic Levels:
Red and gray dotted lines with price symbols.
Pivot Level:
Yellow solid line.
Volatility Support / Resistance Levels:
Gray dotted lines without price designations.
Possible price movement options:
Red and green arrows.
The material has been provided by InstaForex Company - www.instaforex.com