To open long positions on GBP/USD you need:
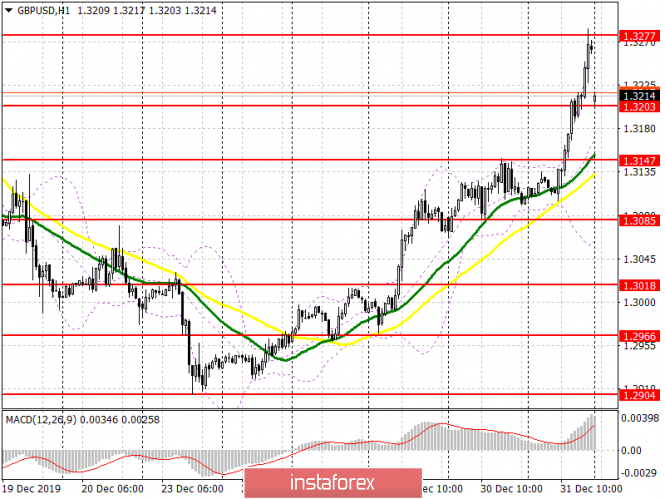
The pound continued to strengthen against the US dollar, thereby confirming the presence of large buyers in the pair, even despite all the pessimism that was associated with Brexit and the trade agreement at the end of last year. At the moment, an important task of the bulls is to maintain support at 1.3203, the formation of which a false breakout in the first half of the day can lead to an increase in GBP/USD and cover the morning gap. However, it will be possible to talk about maintaining the upward momentum only after a break and consolidation above the resistance of 1.3277, which will open a direct path to the highs 1.3348 and 1.3418, where I recommend taking profits. In case a decline occurs below the support of 1.3203, long positions can be returned to the test of a low of 1.3147, where buyers will try to form the lower boundary of the new ascending channel.
To open short positions on GBP/USD you need:
The aim of the sellers will be to support 1.3203, in the area of which the market opened after the new year. Consolidation below this level will quickly push the pound to the lows of 1.3147 and 1.3085, where I recommend taking profits. However, you need to understand that the bulls will try to do everything to go to block the morning gap, especially in case of good data on production activity. Therefore, in a growth scenario, it is best to consider new short positions only after the formation of a false breakout in the support area of 1.3277, but you can sell the pound immediately for a rebound from a high of 1.3348. In case of weak data on manufacturing activity in the UK, pressure on the pound will increase.
Signals of indicators:
Moving averages
Trading is above 30 and 50 moving averages, which indicates the continuation of the upward correction of the pound.
Bollinger bands
In case the pair declines, support will be provided by the average border of the indicator in the region of 1.3167. Growth will be limited by the upper level at 1.3277.

Description of indicators
- Moving average (moving average determines the current trend by smoothing out volatility and noise). Period 50. The graph is marked in yellow.
- Moving average (moving average determines the current trend by smoothing out volatility and noise). Period 30. The graph is marked in green.
- MACD indicator (Moving Average Convergence / Divergence - moving average convergence / divergence) Fast EMA period 12. Slow EMA period 26. SMA period 9
- Bollinger Bands (Bollinger Bands). Period 20
