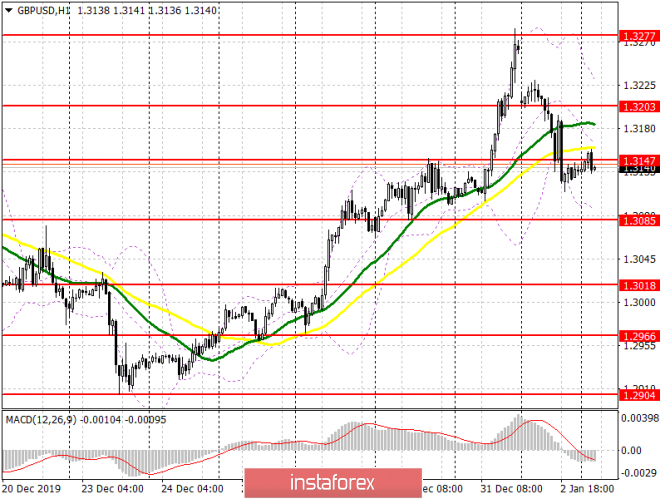
To open long positions on GBP/USD you need:
The worsening situation in the manufacturing sector of Great Britain has caused pressure to form on the British pound and its decline in the area of quite important support levels. An attempt by buyers to stop the fall in the region of 1.3147 was not supported by large players, as a result of which, the bulls now need to fight for level 1.3147, which acts as a resistance. Only a return to this range in the first half of the day will lead to the formation of a larger upward correction in the pair to the area of 1.3203. However, a more important task for the bulls will be to break through this range, which will return GBP/USD to the high of this week in the area of 1.3277, where I recommend taking profits. If pressure on the pound remains after the report on the construction sector, it is best to look at long positions on the support test of 1.3085-70, or buy the pound immediately for a rebound from a low of 1.3018.
To open short positions on GBP/USD you need:
As long as the trade is conducted below resistance at 1.3147, pressure on the pound will remain, and sellers will try to do everything to push the pair even lower to a low of 1.3085. A further goal will be to support 1.3018, where I recommend taking profit. However, the minutes of the Federal Reserve, which will be published in the afternoon, will be no less important. Therefore, in the European session, the emphasis will be shifted only to data on the UK construction industry. In the scenario of the bulls returning to themselves the level of 1.3147, it is best to look at short positions on a false breakout from resistance at 1.3203, but selling the pound right away on a rebound is best only from a high of 1.3277.
Signals of indicators:
Moving averages
Trade is conducted below 30 and 50 moving averages, which indicates the preservation of pressure in the short term.
Bollinger bands
In the case the pair declines, support will be provided by the average boundary of the indicator in the area of 1.3085. Growth will be limited to the upper level around 1.3220.

Description of indicators
- Moving average (moving average determines the current trend by smoothing out volatility and noise). Period 50. The graph is marked in yellow.
- Moving average (moving average determines the current trend by smoothing out volatility and noise). Period 30. The graph is marked in green.
- MACD indicator (Moving Average Convergence / Divergence - moving average convergence / divergence) Fast EMA period 12. Slow EMA period 26. SMA period 9
- Bollinger Bands (Bollinger Bands). Period 20
