To open long positions on GBP/USD you need:
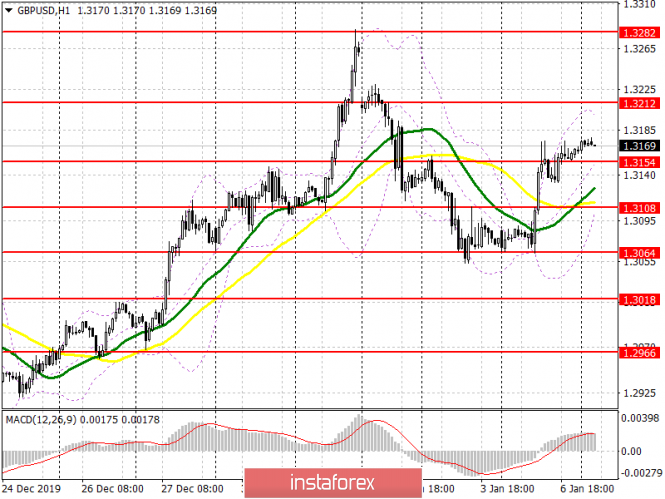
Pound buyers used good data on the service sector yesterday and immediately picked up two levels 1.3108 and 1.3154. At the moment, while trading is above resistance at 1.3154, demand for the pound will continue. The formation of a false breakout in this range in the first half of the day will be an additional signal for opening long positions, the aim of which will be the highs 1.3212 and 1.3282, where I recommend taking profits. Important fundamental statistics for the UK are not expected to be released today, therefore, with the scenario of pulling down GBP/USD to the level of 1.3154, it is best to return to long positions only after updating the low of 1.3108, or buy the pound immediately for a rebound from 1.3064.
To open short positions on GBP/USD you need:
Sellers will try their best to push the pair below support at 1.3154, since the pound's direction depends on it. Consolidating below this range will help the bears break through the moving averages and regain market position, which will lead to updating lows 1.3108 and 1.3064, where I recommend taking profits, as this range will be actively protected by buyers. If the growth of the pound continues in the morning, then with the opening of short positions it is better not to rush. The first optimal level will be a high of 1.3212, where the formation of a false breakout will be a sell signal. Immediately on the rebound, I recommend selling GBP/USD only from the area of 1.3282, which is a high of December 31, 2019.
Signals of indicators:
Moving averages
Trading is slightly above 30 and 50 moving averages, which indicates a shaky advantage for pound buyers.
Bollinger bands
In the event of a decline, the pound will be supported by the lower boundary of the indicator at 1.3105. A break of the upper boundary at 1.3212 will lead to a larger upward trend of the pair.

Description of indicators
- Moving average (moving average determines the current trend by smoothing out volatility and noise). Period 50. The graph is marked in yellow.
- Moving average (moving average determines the current trend by smoothing out volatility and noise). Period 30. The graph is marked in green.
- MACD indicator (Moving Average Convergence / Divergence - moving average convergence / divergence) Fast EMA period 12. Slow EMA period 26. SMA period 9
- Bollinger Bands (Bollinger Bands). Period 20
