To open long positions on GBP/USD you need:
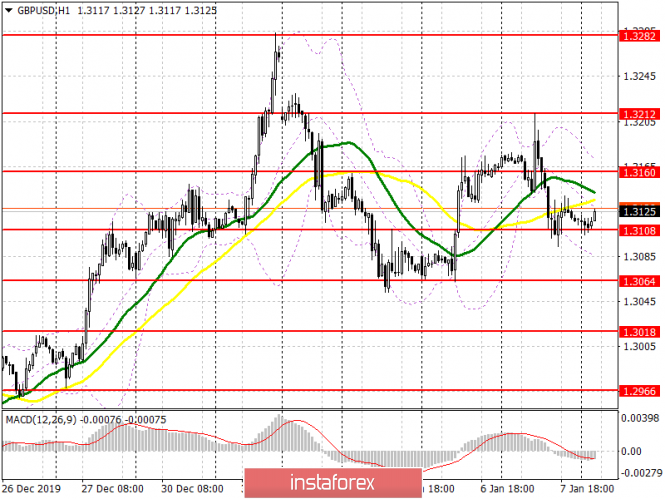
The British pound is locked in the side channel 1.3065-1.3212, beyond which it will determine the further direction of the pair. The first priority for buyers today is to maintain intermediate support at 1.3108, the formation of a false breakout will be a signal to open long positions in the expectation of a break and consolidation above resistance at 1.3160, which will lead to the upper boundary of the side channel at 1.3212, where I recommend taking profit. Only a breakthrough of this range will allow us to expect a return to annual highs in the area of 1.3282 and their update in the area of 1.3348. In the scenario of pulling down GBP/USD to the level of 1.3108, you can return to long positions on the test of the lower boundary of the channel around 1.3065, or buy the pound for a rebound from a low of 1.3018, calculated at 25-30 points of upward correction.
To open short positions on GBP/USD you need:
Important fundamental statistics are not published today, but the work of the British Parliament resumes after the holidays. This can revitalize the pound. Bears will seek to break the support of 1.3108, since consolidating just below this level will quickly push GBP/USD to the lows of 1.3064 and 1.3018, where I recommend taking profits. The formation of a false breakout and unsuccessful consolidation in the first half of the day above the resistance 1.3160 will also be an additional signal to open short positions in the pair. Otherwise, it is best to sell the pound by rebounding from the upper boundary of the side channel at 1.3212, or after a test of a high at 1.3282, while aiming for a downward correction of 25-30 points.
Signals of indicators:
Moving averages
Trade is conducted in the region of 30 and 50 moving average, which indicates the lateral nature of the market.
Bollinger bands
In the event of a decline, the pound will be supported by the lower boundary of the indicator at 1.3087, the break of which will increase the pressure on the pair. A break of the upper boundary at 1.3165 will lead to a larger upward trend.

Description of indicators
- Moving average (moving average determines the current trend by smoothing out volatility and noise). Period 50. The graph is marked in yellow.
- Moving average (moving average determines the current trend by smoothing out volatility and noise). Period 30. The graph is marked in green.
- MACD indicator (Moving Average Convergence / Divergence - moving average convergence / divergence) Fast EMA period 12. Slow EMA period 26. SMA period 9
- Bollinger Bands (Bollinger Bands). Period 20
