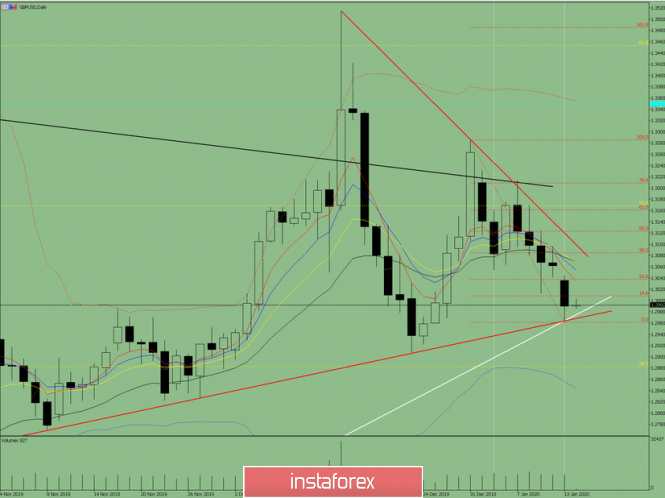
Trend analysis (Fig. 1).
Today, the price may push off from the support line 1.2965 presented in a white bold line and start moving up with the goal of 1.3085 which is a pullback level of 38.2% presented in a red dotted line. If this line is reached, a continuation of work up with the goal of 1.3161 which is a pullback level of 61.8% presented in a red dotted line.

Fig. 1 (daily chart).
Complex analysis:
- Indicator analysis-up;
- Fibonacci levels-up;
- Volumes-up;
- Candle analysis-up;
- Trend analysis-up;
- Bollinger lines-up;
- Weekly chart - the up.
General conclusion:
The price may start moving up today.
A downward scenario is unlikely but quite possible. From the level of 1.2990, the closing of yesterday's daily candle, work down with the goal of 1.2905, the lower fractal.
The material has been provided by InstaForex Company - www.instaforex.com