4-hour timeframe

Technical data:
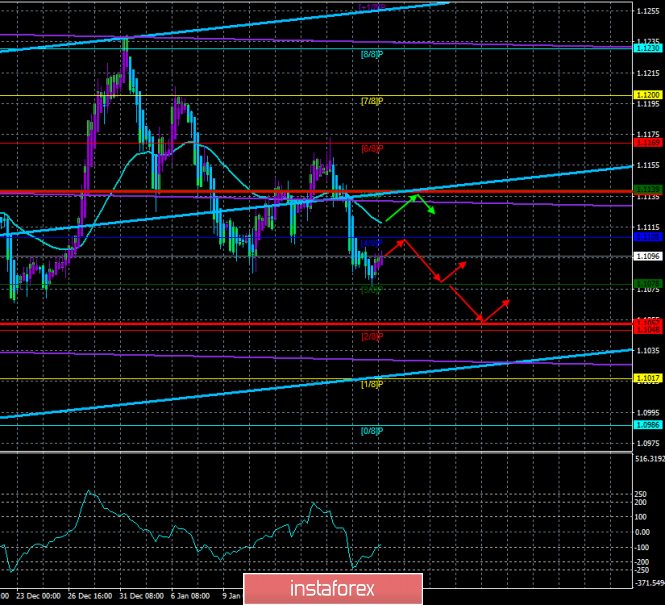
The upper channel of linear regression: direction - upward.
The lower channel of linear regression: direction - sideways.
The moving average (20; smoothed) - down.
CCI: -82.3221
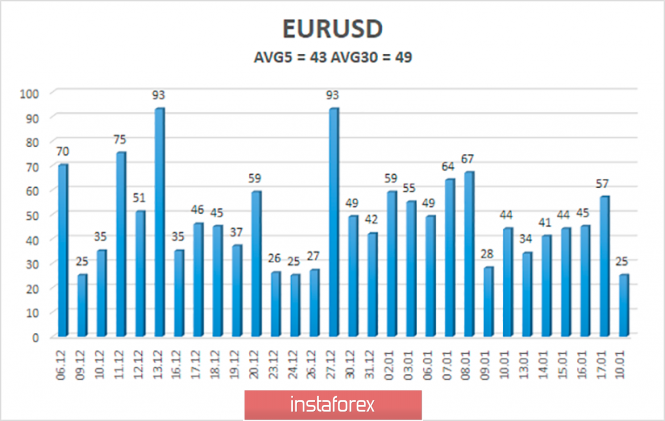
Today, the EUR/USD currency pair starts in a weak downward correction. The pair's quotes rebounded yesterday from the Murray level of "3/8" - 1.1078, and we expected a correction at the beginning of the day due to the semi-exit status of Monday. No important and interesting macroeconomic reports were published yesterday. Thus, the volatility value of 25 points is normal for such a day. Now, traders are advised to wait for the current correction to complete to resume trading on the downside. The correction target is the moving average line.
Meanwhile, yesterday, January 20, was the anniversary of the inauguration of the American President. On such a day, Donald Trump has already managed to sum up the results of his three-year work as President, and, of course, he highly appreciated the results of his activities. In particular, Trump noted the lowest unemployment in the country in the last 50 years, as well as the lowest unemployment among African-Americans. While Trump is resting on his laurels and traveling around America with campaign speeches (although the election is still about 9 months away), the Senate today begins considering the case for the impeachment of the President of the United States. "The Senate should speedily reject these defective articles of impeachment and acquit the President," Trump himself said. The US leader also once again accused the Democrats of falsifying the entire impeachment process, saying that attempts to remove him from the post of President have been dragging on since he took office. According to experts, the entire procedure for reviewing the case in the Senate will take no more than two weeks. Moreover, the Democrats are interested in a detailed study of the case, with the statements of absolutely all the witnesses and consideration of all the testimony, while the Republicans want to complete the process as quickly as possible, in a few days. In general, the whole process will simply be a confrontation between Democrats and Republicans.
Over the next two weeks, traders' attention will certainly be focused on the impeachment process in the United States, but do not forget that macroeconomic statistics are more important. However, unfortunately, it is with macroeconomic statistics that there will be problems in the coming days. No important macroeconomic publications are planned in the United States and the European Union today or tomorrow. Today, traders will have to settle for only the ZEW index of sentiment and assessment of current economic conditions in Germany and the EU. And tomorrow we will see statistics on sales and prices in the US housing market. These reports are unlikely to cause at least some reaction from traders, so the low volatility of the euro-dollar pair may continue for several days.
In such a situation, when there are no news and reports, we can only wait and consider the general fundamental background, which for the euro-dollar pair remains unchanged. We still believe that the fundamental background speaks eloquently in favor of a further appreciation of the US currency, but we believe that for successful trading, the fundamental background and the technical picture must coincide. Accordingly, the location of the price below the moving average line can be considered a favorable factor for selling the pair. The US and EU Central Banks are unlikely to change their monetary policies soon, so we should not expect any changes in the imbalance between the US and the EU. Monetary policy and the US economy remain much stronger, and only industrial production, which has declined significantly in the past year and a half, is causing concern for the future of the US economy. However, the Fed has so far been very successful in leveling the losses of the industrial production sector by lowering rates and stimulating the economy with cash.

The average volatility of the euro-dollar currency pair is currently 43 points and is declining again. Thus, we have volatility levels of 1.1052 and 1.1138 as of January 21. Turning the Heiken Ashi indicator down will indicate the completion of the corrective movement. On Tuesday, given the zero macroeconomic background, the continuation of the correction is possible.
Nearest support levels:
S1 - 1.1078
S2 - 1.1047
S3 - 1.1017
Nearest resistance levels:
R1 - 1.1139
R2 - 1.1169
R3 - 1.1200
Trading recommendations:
The euro-dollar pair started to adjust. Thus, sales of the European currency with the goals of 1.1078 and 1.1052 are relevant now after the Heiken Ashi indicator turns down. It is recommended to return to the pair's purchases with the goal of 1.1139 not earlier than the reverse overcoming of the moving average.
In addition to the technical picture, you should also take into account the fundamental data and the time of their release.
Explanation of the illustrations:
The upper channel of linear regression - the blue lines of the unidirectional movement.
The lower channel of linear regression - the purple lines of the unidirectional movement.
CCI - the blue line in the indicator window.
The moving average (20; smoothed) - the blue line on the price chart.
Murray levels - multi-colored horizontal stripes.
Heiken Ashi - an indicator that colors bars in blue or purple.
Possible variants of the price movement:
Red and green arrows.
The material has been provided by InstaForex Company - www.instaforex.com